No Bloomberg terminal, no expensive subscription, no login. The Alien Analyzer V2 is a browser-based value investing tool – free, directly on alien-investor.org. Enter a ticker, hit Enter – and within seconds you get a structured overview of a stock's valuation, metrics, and quality.
Data comes from Yahoo Finance via a dedicated proxy. No API key required. The tool runs entirely in the browser – a single HTML file, no framework, no build step. Here is what the four tabs show.
Tab 1 – Fair Value

The most important tab for value investors. You see the historical price chart – and above it a P/E ratio fan: several lines, calculated from the EPS history multiplied by various historical P/E levels (lower, mid, upper percentile).
Is the current price well above the fan? Historically expensive. Is it below or at the lower edge? Potential undervaluation. The sidebar gives you the Fair Value Indicator as a compact verdict.
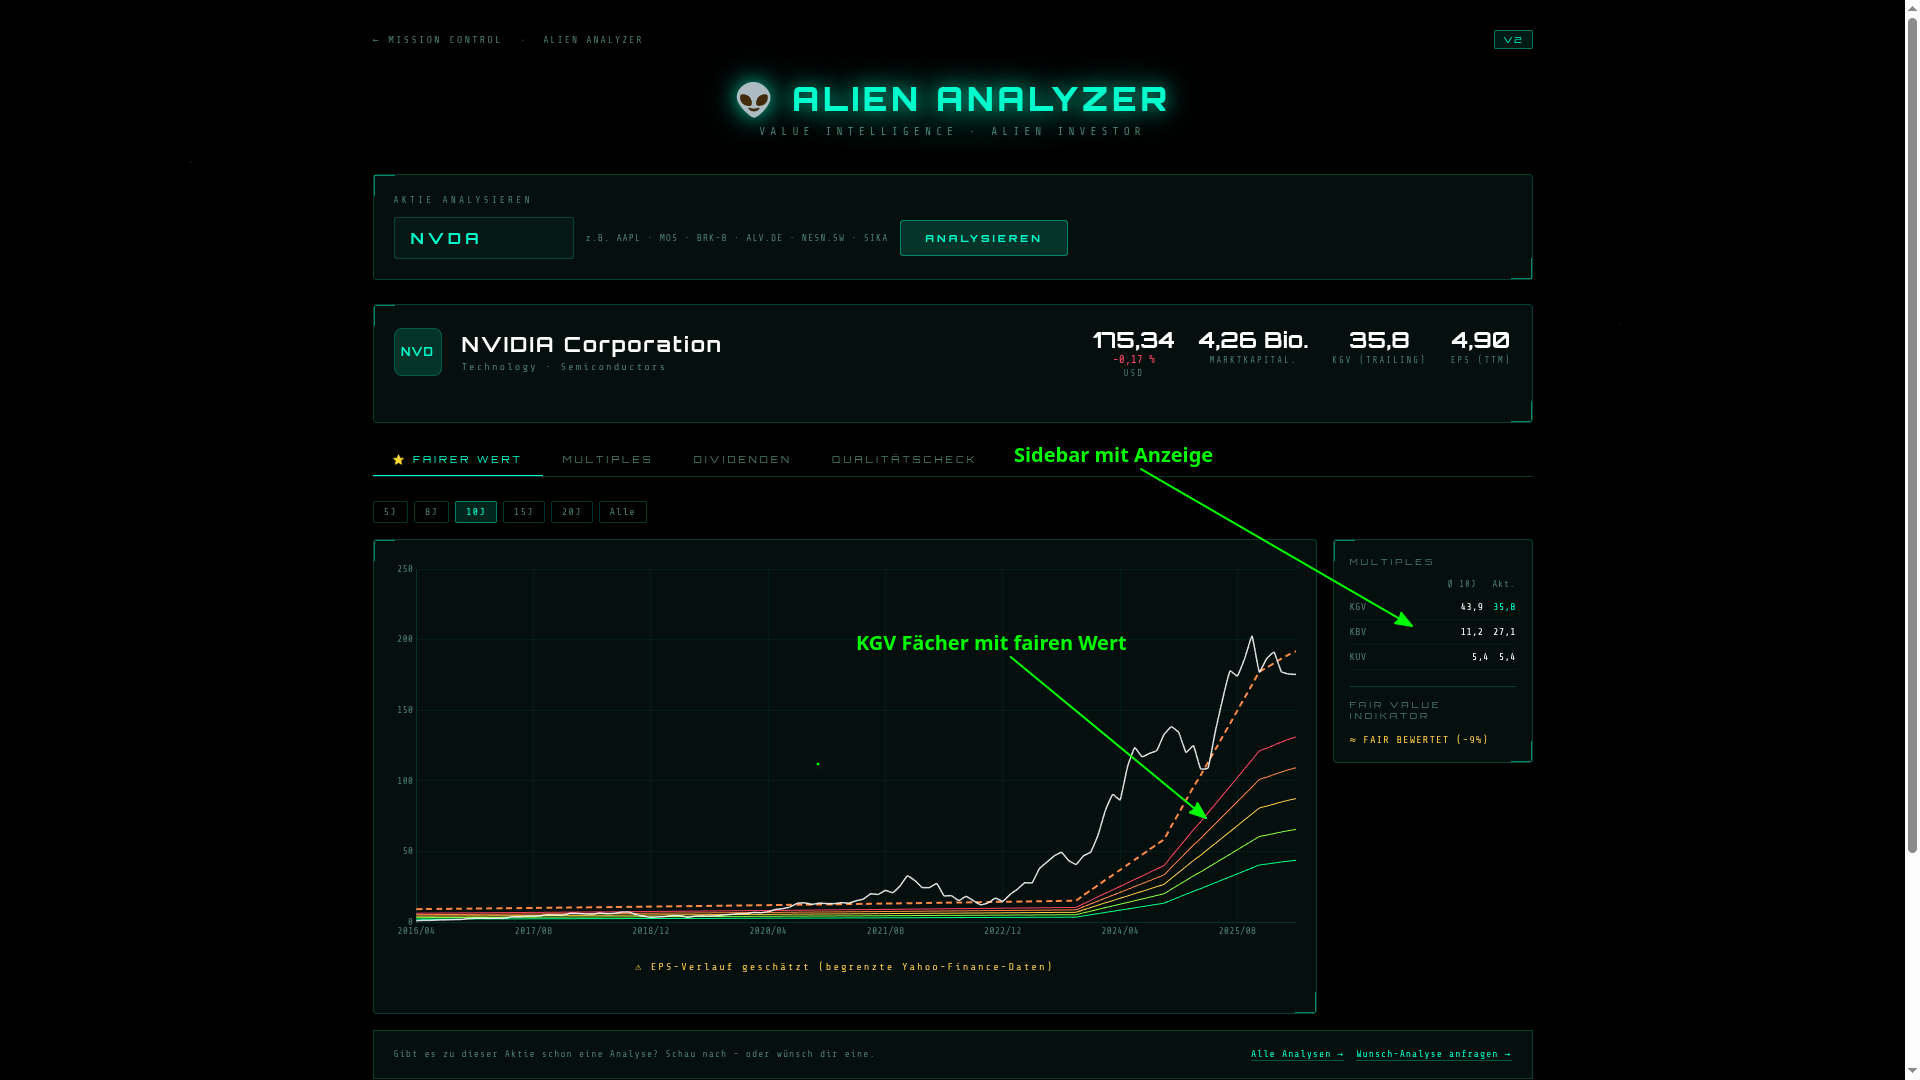
NVIDIA in the Fair Value tab – P/E fan showing historical valuation corridors
Tab 2 – Multiples

A single snapshot figure says little. What matters is how it compares to its own history. Tab 2 shows P/E, P/CF, P/S, and P/B historically as lines – over up to 20 years.
This lets you see at a glance whether the current level is historically high or moderate. A GAAP filter marks outliers caused by one-time effects – so that exceptional write-downs do not distort the picture.
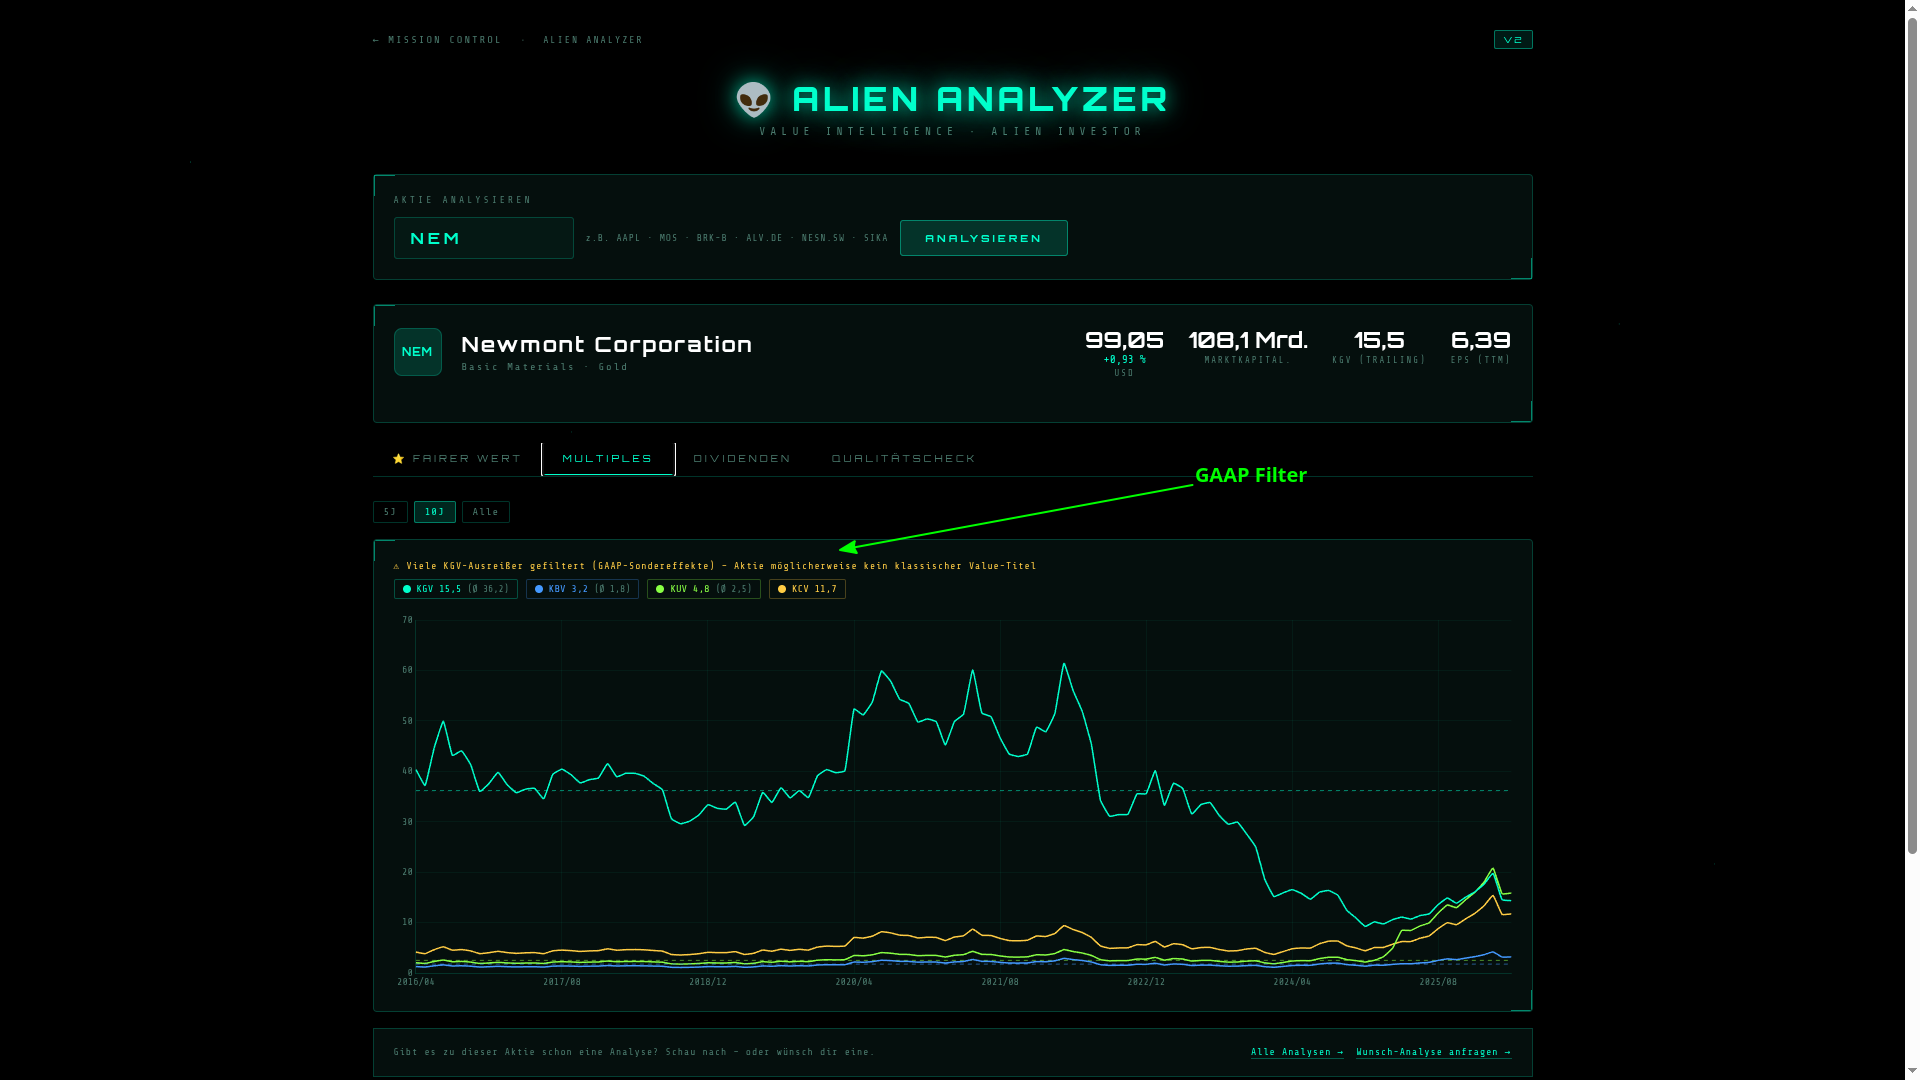
Newmont in the Multiples tab – P/E, P/B, P/S, and P/CF over time
Tab 3 – Dividends

The most relevant tab for dividend investors. The dividend yield is displayed historically as a bar chart, supplemented by a smoothed yield line and a color-coded yield corridor – showing where the yield was historically considered attractive or expensive.
The sidebar adds dividend growth (DPS) over 12 months, 2, 5, and 10 years. This way you see not just the current yield, but whether the company is consistently growing it.
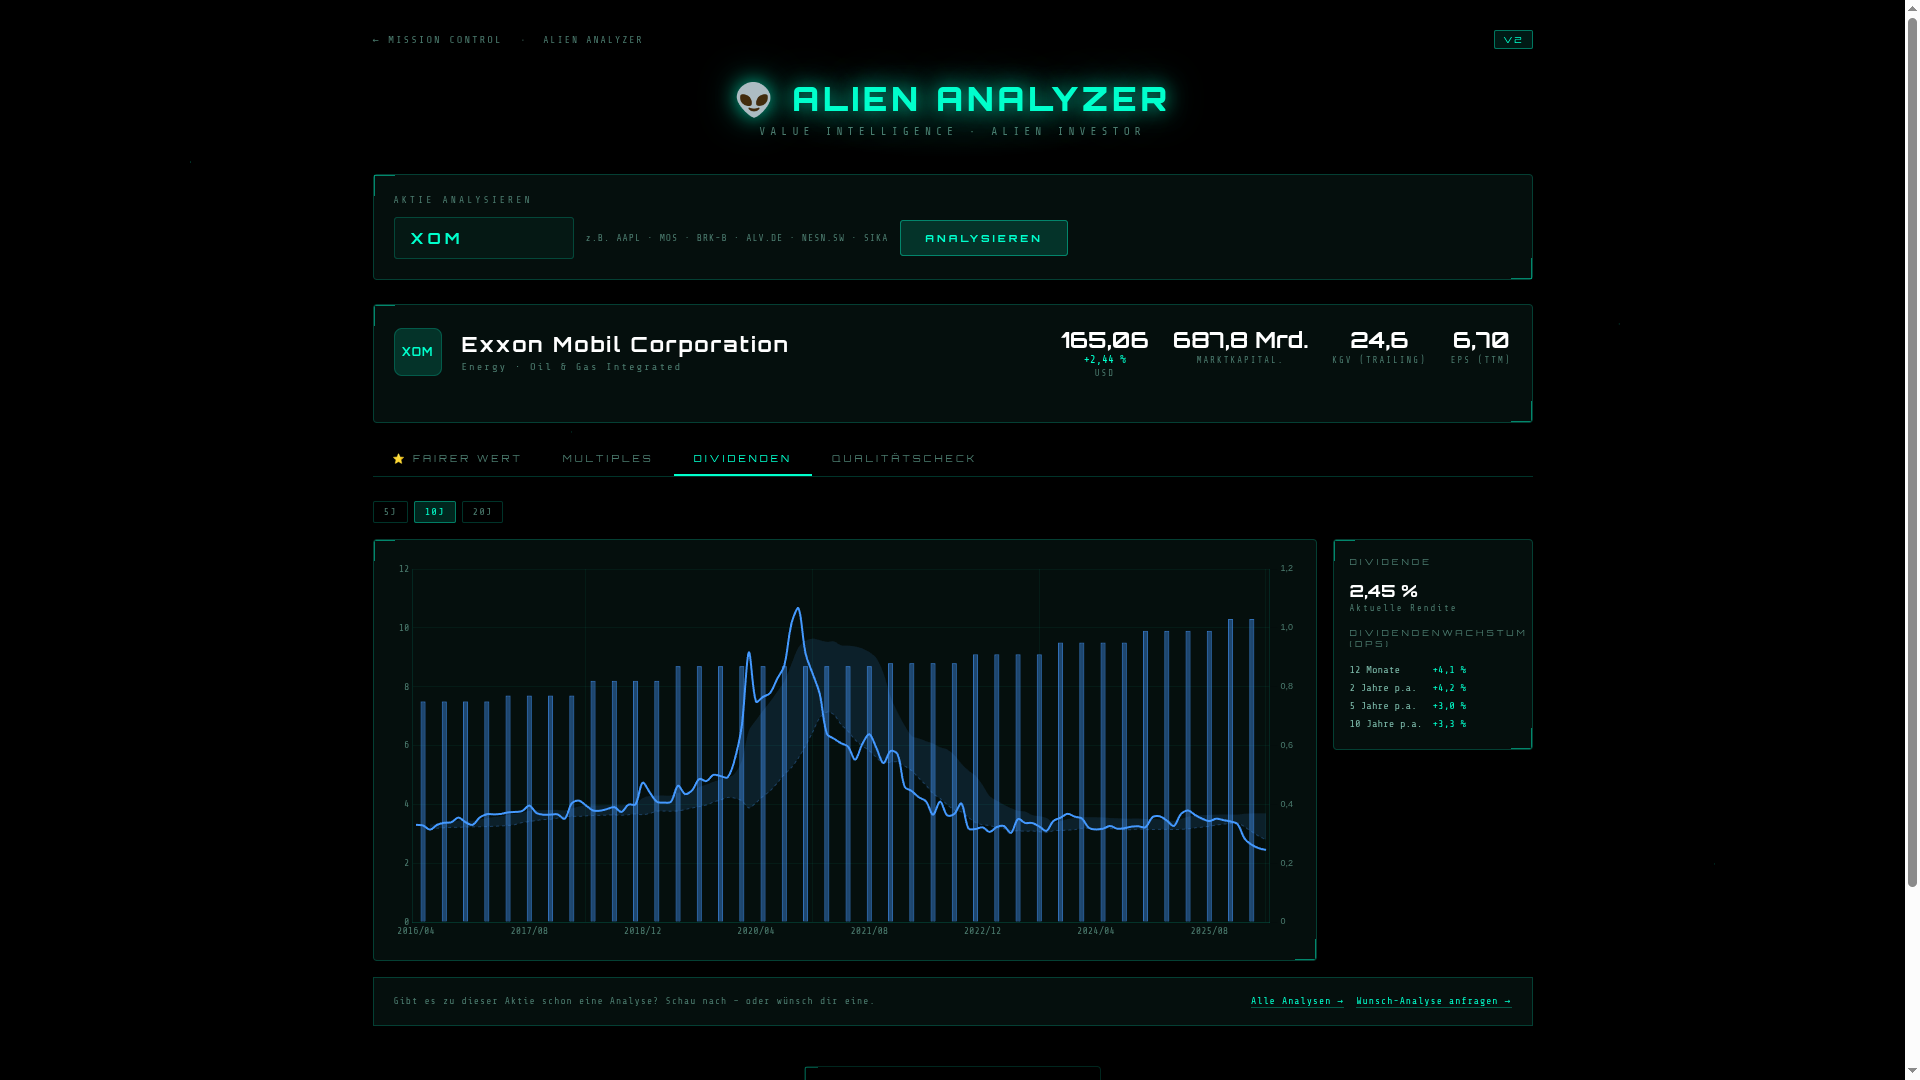
Exxon Mobil in the Dividends tab – yield history and dividend growth
Tab 4 – Quality Check & Alien Assessment

Numbers alone are not enough. Tab 4 sorts the key fundamentals into a traffic-light table: ROE, margins, debt/equity, free cash flow, equity ratio, earnings growth, share buybacks – each metric with a clear signal: GOOD, STRONG, EXPENSIVE, HIGH, LOW, or STABLE.
At the end of the tab the Alien Assessment appears – an automatically generated plain-text comment explaining the particularities of the stock in question. For a REIT, for example: why P/E is irrelevant here and FFO is the decisive metric. For a commodity company: why cyclical earnings slumps structurally distort multiples. The tool recognizes these special cases and provides context instead of bare numbers.
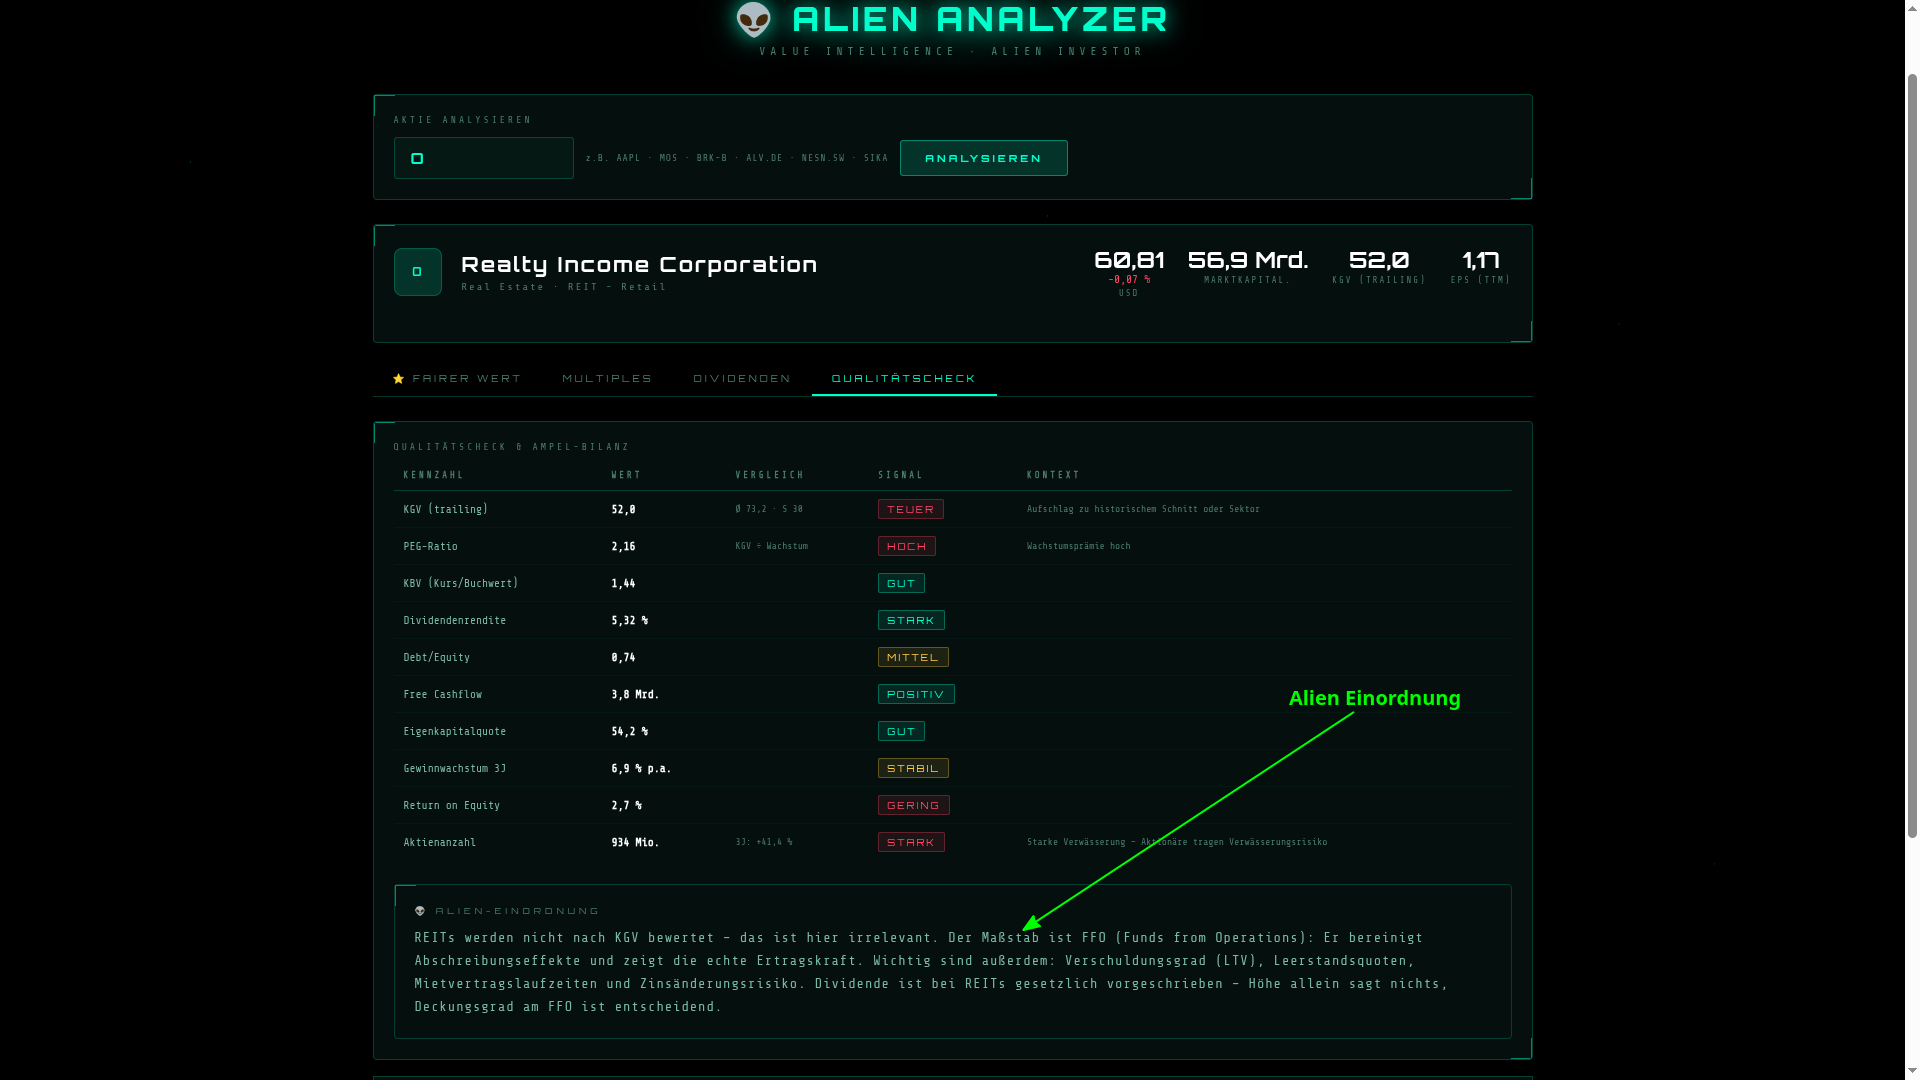
Realty Income in the Quality Check – traffic-light table and Alien Assessment
Conclusion
The Alien Analyzer V2 is not a replacement for your own research and not a trading signal. It is a scan tool – fast, free, no registration needed. Enter a ticker, click through four tabs: you have more context than most retail investors who only look at the current price.
Which stocks are supported? Essentially anything with a Yahoo Finance ticker –
US stocks, German tickers (e.g. ALV.DE), Swiss tickers (NESN.SW)
and many other international securities.
Trust no one – manage your finances yourself.
The tool is free and runs directly in your browser – no login, no subscription:
Open Alien Analyzer V2 →