Bitcoin Price Analysis – February 2026: Retail Is Nearly Out
By Alien Investor – As of: mid-February 2026.
We are observing a rare phase of market inefficiency. While the thermodynamic reality of the network
(hashrate, block production) remains massively robust, the price has decoupled through short-term liquidity
crunches and emotional capitulation. Bitcoin is currently trading in a volatile range between
66,000 and 70,000 USD.
"This analysis deconstructs the discrepancy between price and value. It is not a buy recommendation,
but a tool for orientation in the four-dimensional space of time, price, adoption, and energy."
Bottom Line in One Sentence
The market is wrong: it is currently pricing Bitcoin as a risk-laden tech derivative, while whales accumulate as aggressively as they have not since 2022 — we are in a zone of deep undervaluation.
1) Quick Overview & Current Situation
Price: ~68,000 USD (drawdown of approx. 45% from ATH).
Market capitalization: Consolidation after the hype.
Sentiment: Extreme Fear (Crypto Fear & Greed Index < 10).
Status: Massive divergence between weak price and an extremely strong network.
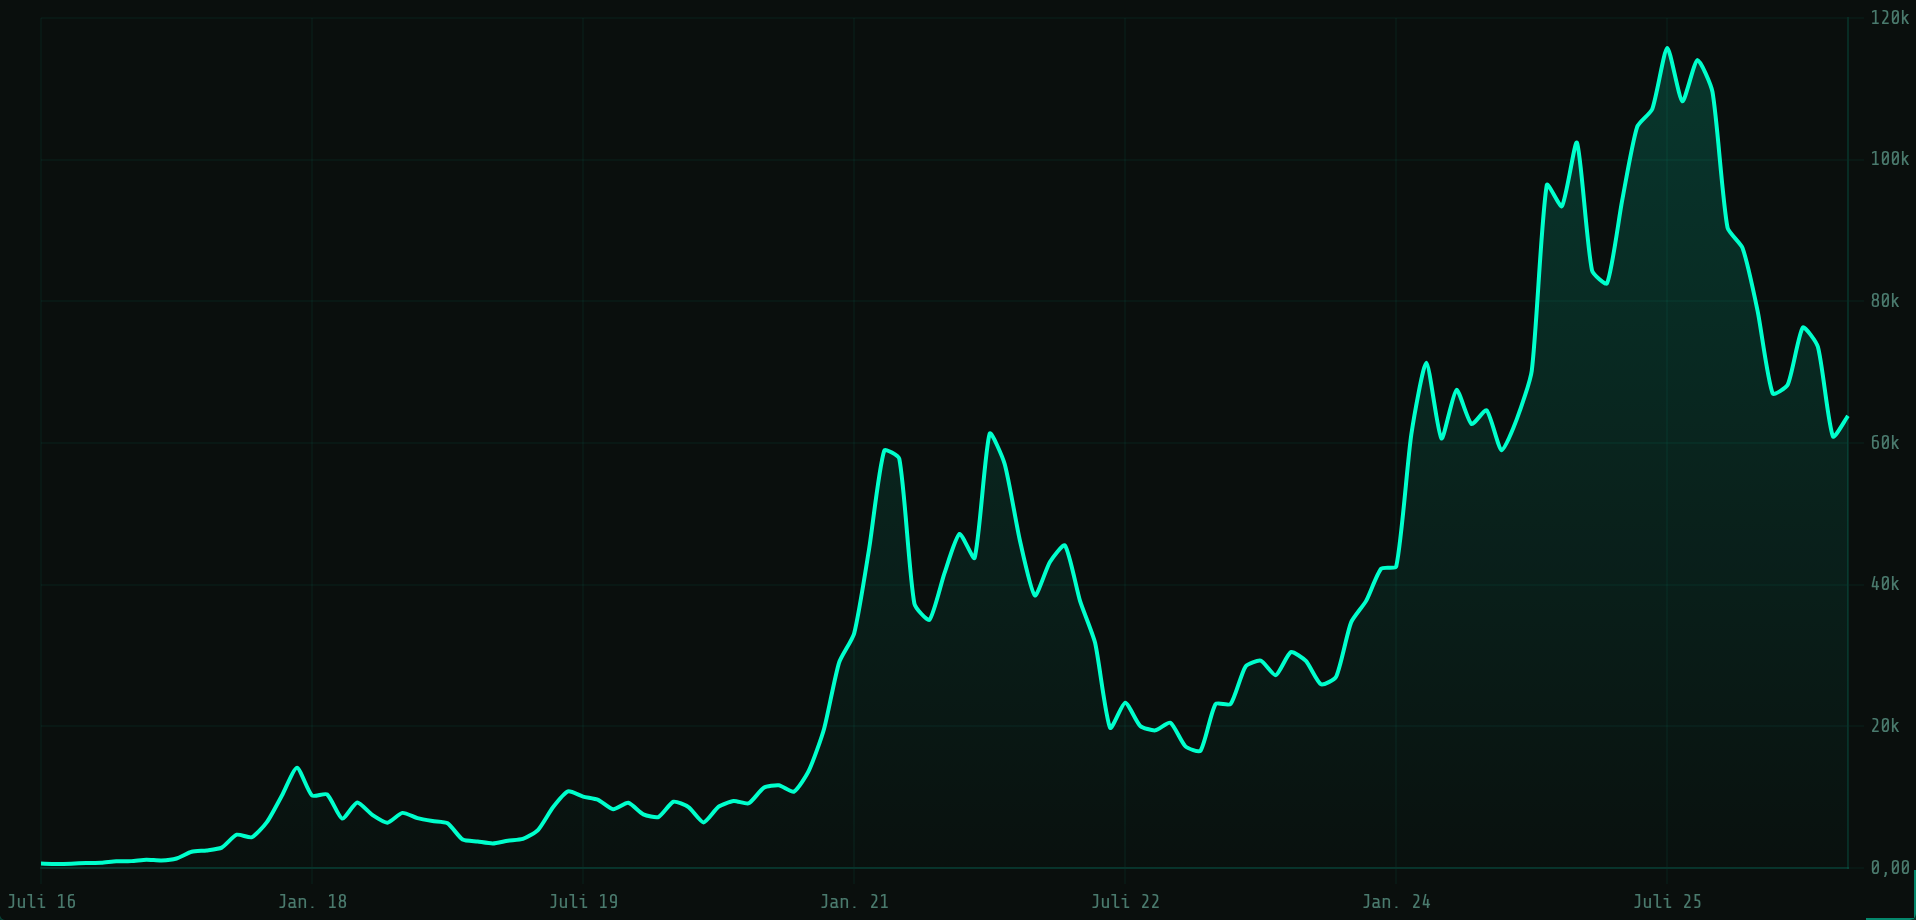
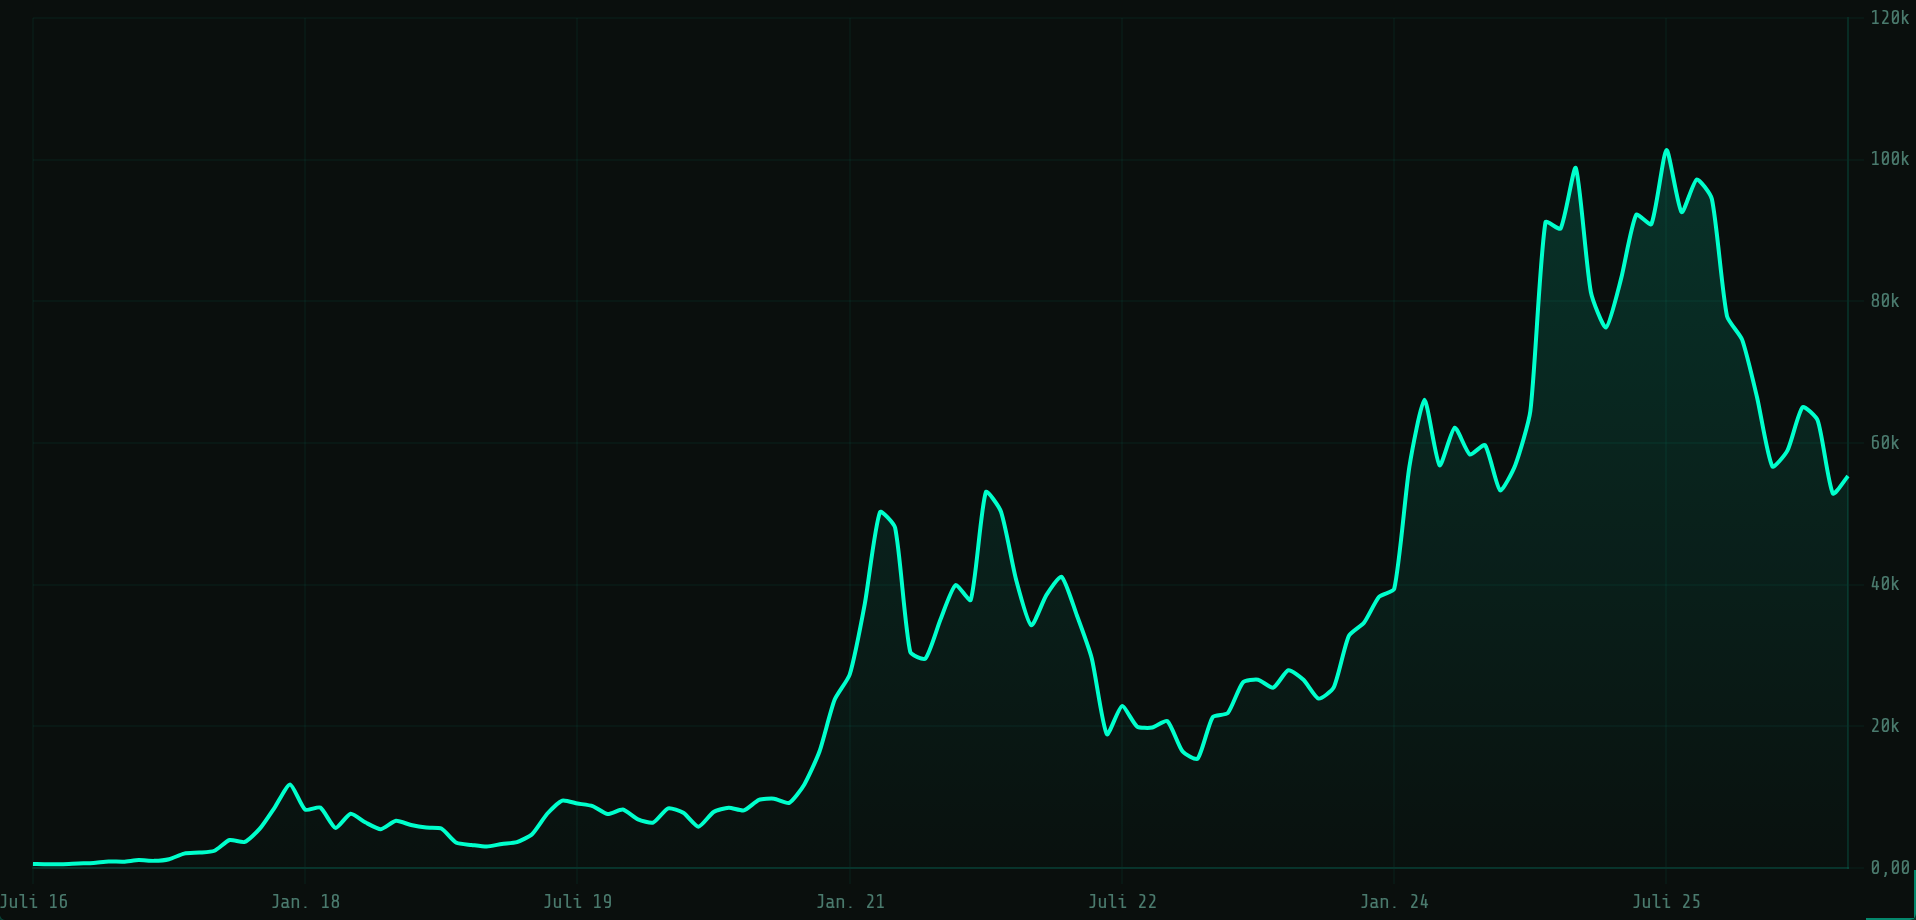
Bitcoin / USD: the long-term chart shows the pattern: explosive cycles followed by consolidation at a higher level. Snapshot of our live charts. Current values available there anytime.Bitcoin / EUR: the relevant yardstick for European savers. Snapshot of our live charts.
2) Macro Environment: Monetary Stasis
Central banks are keeping the reins tight. Despite an inflation rate of 2.4% in the US, the "Higher-for-Longer"
regime persists because the labor market is too strong. Liquidity is being drained from the markets.
The consequence: Capital flees risk assets. Correlation to tech stocks is high, while the market
still does not recognize Bitcoin for what it is: a neutral, censorship-resistant ledger.
3) Bitcoin-Gold Ratio: The Arbitrage of Reality
A massive warning signal for market inefficiency is the decoupling of gold and Bitcoin.
Gold: Has broken through the 5,000 USD/oz mark and is celebrating all-time highs as a "safe haven".
The anomaly: The market is selling the mathematically harder asset (Bitcoin, fixed supply) in favor of the softer asset (gold, elastic supply).
Interpretation: This is pure fear psychology. Historically this ratio tends to adjust violently once the panic subsides.
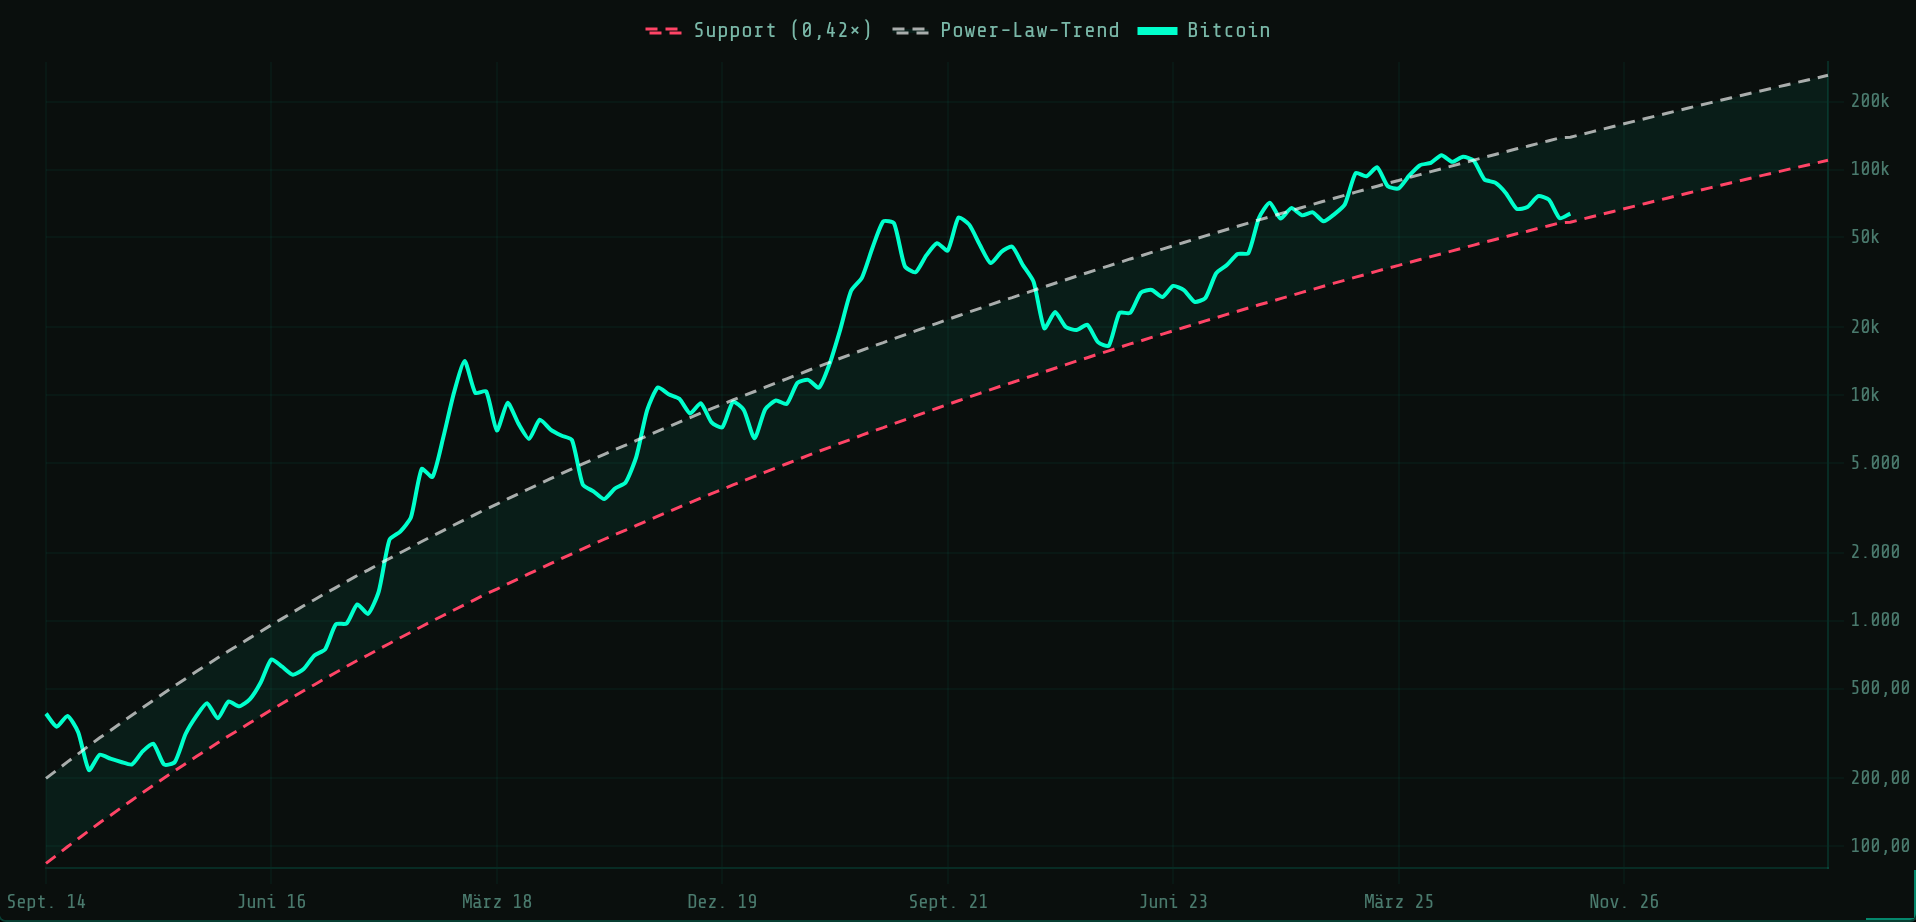
4) Valuation Models: Power Law & Mayer Multiple
Let's step away from price and look at the mathematics of growth curves.
Power Law: Price is trading in the lower band of the logarithmic growth channel.
In relation to "activity-adjusted time," Bitcoin is extremely cheap.
Mayer Multiple: The value sits at an extremely low 0.65 – 0.68.
That means: Bitcoin is far below its own 200-day moving average. Such readings have historically been excellent entry opportunities.
Bitcoin in the Power Law corridor (log scale): white line = fair model trend, red line = support (trend × 0.42). Snapshot of our live charts.
What Is the Power Law?
Plot the Bitcoin price on a double-logarithmic scale against time since the genesis block (January 3, 2009), and for over 15 years it has stayed remarkably close to a straight line. A straight line in a log-log chart means the price grows according to a power law, not exponentially, but flattening over time while still climbing. The trend (white) is the fair model value the price oscillates around in cycles: sometimes far above it (euphoria), sometimes well below (bear market). The support (red, trend × 0.42) is the lower corridor boundary that no bear-market bottom has ever broken sustainably.
Right now the price sits in the lower corridor, much closer to the support than to the fair trend. Historically, these were exactly the zones where patient accumulation paid off. Important: the power law is a statistical observation, not a law of nature. It describes the past well, but it is no guarantee for the future. Use it as a map for orientation, not as a promise.
5) On-Chain Forensics: Pain and Bottom Formation
Who is actually selling here?
MVRV Ratio (~1.1): We are approaching the undervaluation zone (< 1.0). The speculative air is completely gone.
Retail (small investors): Panic selling. On February 5th alone, losses of 5.4 billion USD were realized.
Whales (smart money): While retail bleeds, whales accumulated over 70,000 Bitcoin in a single week.
6) Market Structure: ETF Flows & Open Interest
The structure shows that primarily "hot money" is heading for the exits:
ETF flows: Net outflows (e.g. -276 million USD in a single day). The "tourists" are leaving.
Derivatives: Open interest (OI) has collapsed by 55%. The market is cleaned up ("deleveraging"). The risk of a long squeeze is minimal.
Stablecoins: Over 22 billion USD in "dry powder" sitting on the sidelines.
7) Network Check: The Physical Truth (Hashrate)
While the price weakens, the energy in the network remains enormous. The hashrate sits at approx. 895 EH/s and difficulty at 125.86 T.
The signal: The network is securing value with massive physical energy, undisturbed by price. The fundamental integrity is unshakeable.
8) Buy Ranges: A Strategic Framework
Based on the data, the following scenarios emerge for the rational owner:
Scenario A – Consolidation (60k – 75k USD):
The most likely scenario. Sideways movement until macro liquidity returns. Ideal for DCA.
Scenario B – The Flush-Out (55k / 42k USD):
Should the 200-week line (~57k) break, a drop to the Realized Price (55k) or in the extreme case 42k looms. That would be the ultimate capitulation.
Scenario C – Supply Shock (> 80k USD):
Whale accumulation leads to supply scarcity. Once demand returns, the price explodes upward.
Risk Warning: The zone around the 200-week moving average (~57,000 USD) is critical. If this support breaks on a weekly close, a bearish acceleration looms. Never use leverage in this environment. Spot only, cold storage only.
Tools for Real Owners
If you want to hold Bitcoin as self-sovereignly as possible, don't use your bank's brokerage account:
Buy Bitcoin in Europe – 21bitcoin:
Bitcoin-only app from Europe, ideal for DCA and stacking sats regularly — no shitcoins.
Use code ALIENINVESTOR for a permanent 0.2 percentage point fee reduction
on instant and savings plan purchases. https://alien-investor.org/21bitcoin
₿ Bitcoin in self-custody:
Hardware wallet instead of exchange account. I use the BitBox — there is the classic BitBox02 and the new
BitBox for iPhone (Nova). https://alien-investor.org/bitbox
Privacy & Mail:
For email, VPN, and cloud I use Proton — data-minimal and without Big Tech dependency. https://alien-investor.org/proton
Note: Some of the links above are affiliate links. Using them supports my work at no extra cost to you. Thanks!
Sources (Selection)
This analysis is based on on-chain data (Glassnode: MVRV, hashrate, whale accumulation), ETF flow data (Farside), and macroeconomic indicators (Fed data, gold price). As of: February 2026.