Bitcoin Price Analysis – June 2026: Back at the Power Law Support
By Alien Investor – As of: June 8, 2026.
The market is capitulating. After weeks of record outflows from the spot ETFs, Bitcoin has fallen from around
77,000 USD in late May to roughly 63,500 USD. Sentiment is in the gutter, the Crypto Fear &
Greed Index sits at 8, extreme fear. This is exactly the phase where it pays to look away from the daily price
and toward the models: our Power Law corridor shows Bitcoin right at the support, the zone
where every cycle bottom has historically formed.
"This analysis deconstructs the discrepancy between price and value. It is not a buy recommendation,
but a tool for orientation in the four-dimensional space of time, price, adoption, and energy."
Bottom Line in One Sentence
Bitcoin sits at a corridor position of around 10 percent, almost exactly on the Power Law support and 54 percent below the model trend. With extreme fear, record ETF outflows, and an on-chain market valued near fair value, this is historically the zone of accumulation, not panic.
1) Quick Overview & Current Situation
Price: ~63,500 USD (on June 3 an intraday low of 65,708 USD, down 6.4% in 24 hours).
Decline: from around 77,000 USD in late May to below 64,000 USD, a sharp sell-off within days.
Sentiment: Extreme Fear (Crypto Fear & Greed Index at 8, still 12 on June 6).
Status: Bitcoin at the Power Law support, on-chain near fair value. The price falls, the valuation gets cheap.
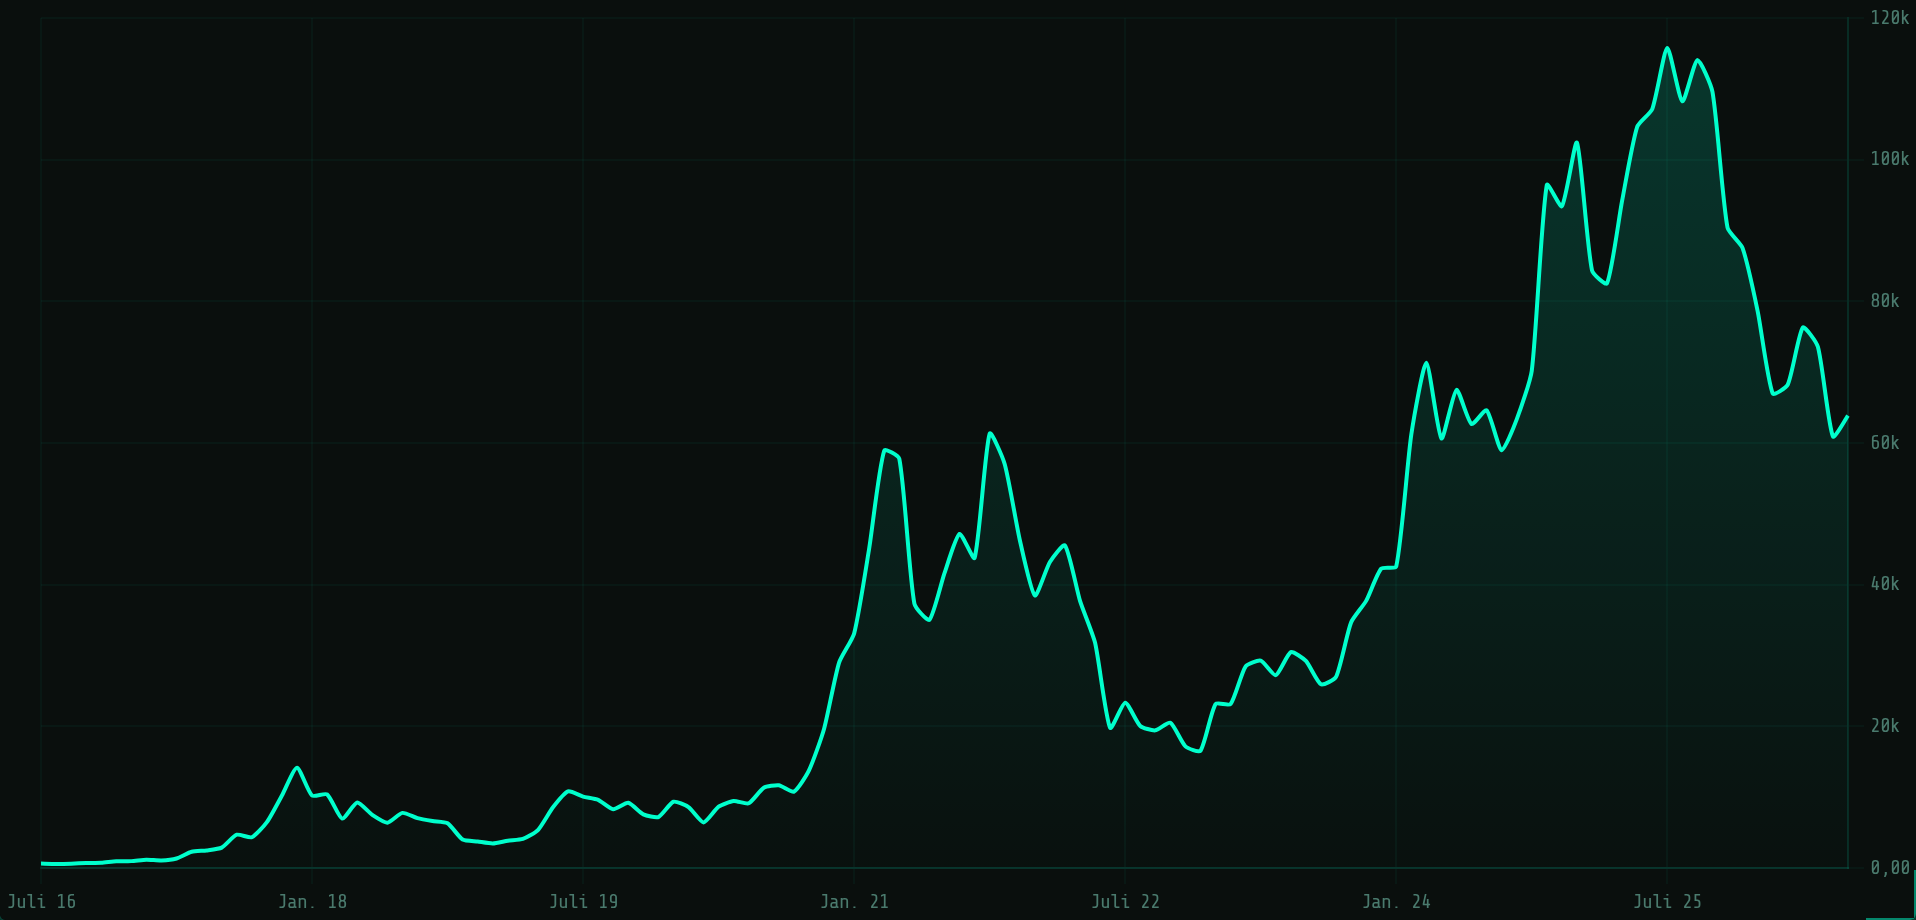
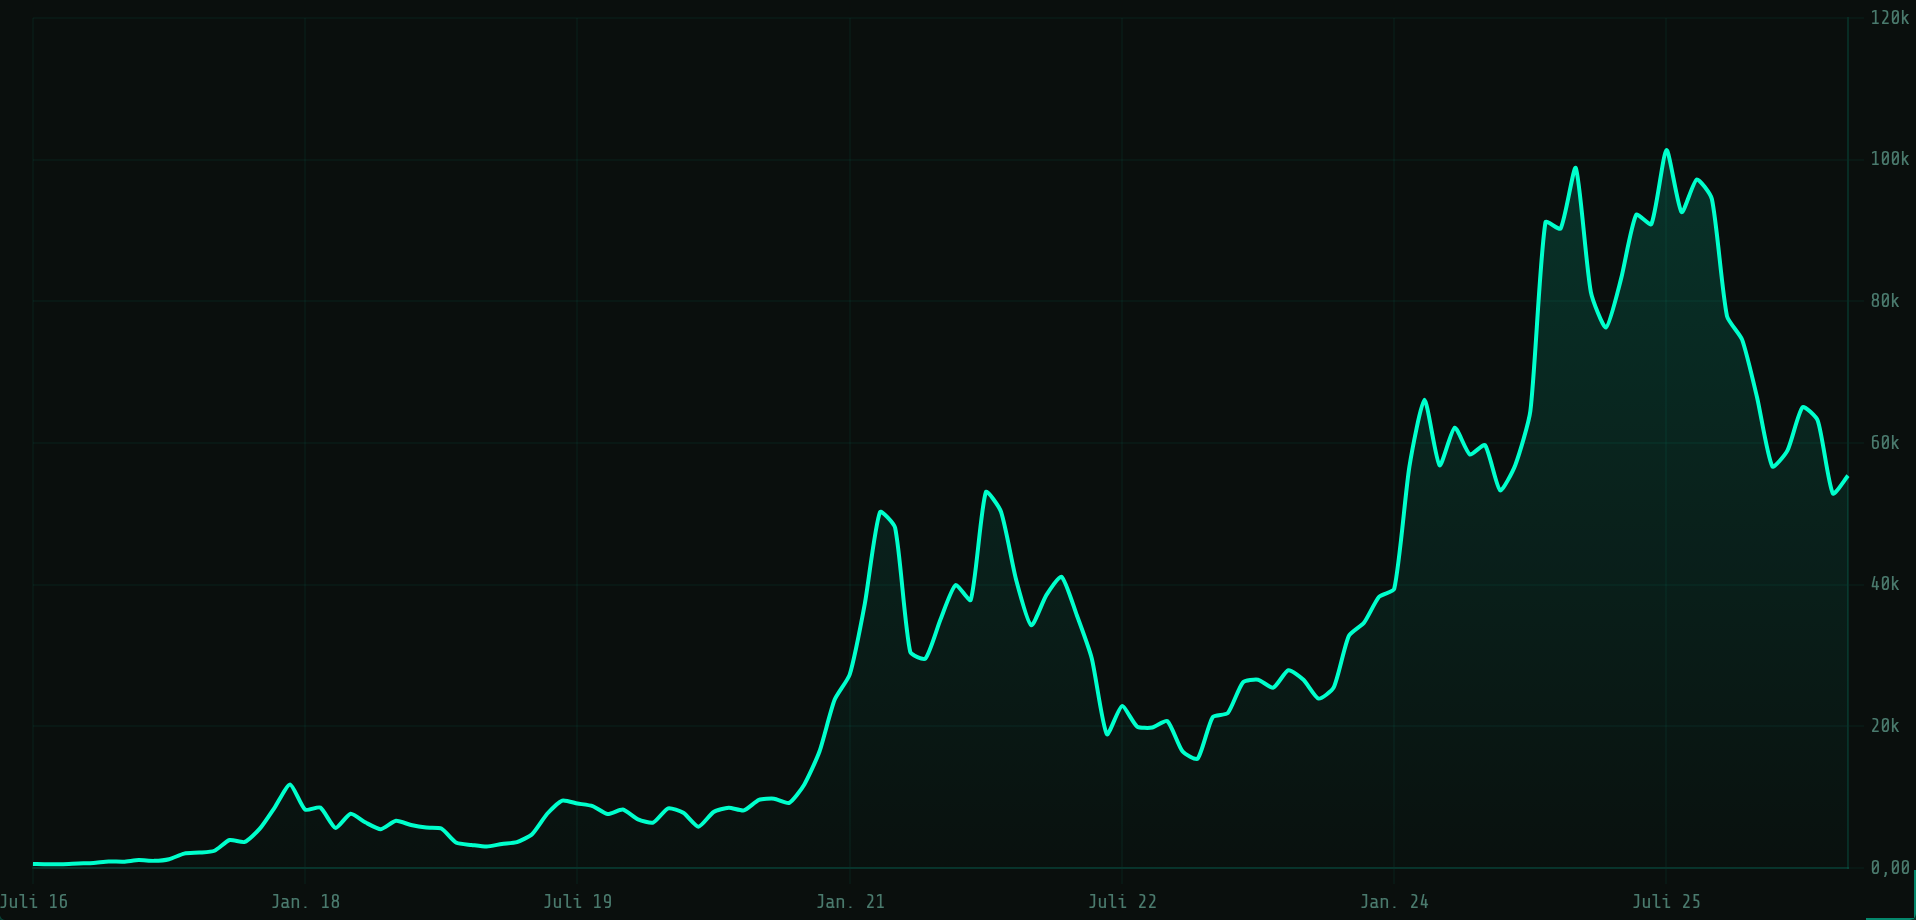
Bitcoin / USD: the long-term chart shows the pattern: explosive cycles followed by consolidation at a higher level. Snapshot of our live charts. Current values available there anytime.Bitcoin / EUR: the relevant yardstick for European savers. Snapshot of our live charts.
2) Macro Environment: Risk-off and Institutional Flight
The trigger for this sell-off is not the network, it is the flow of capital. Institutional addresses are pulling
back from risk assets, and Bitcoin gets treated like a leveraged tech stock: sold first when nerves are raw.
The consequence: Capital is leaving the spot ETFs like never before, and even companies with
Bitcoin on their balance sheet are adjusting positions. The market is pricing short-term liquidity, not the
long-term value of a neutral, censorship-resistant ledger. This very gap between price and substance is the
core of this analysis.
3) Where the Institutional Buyers Sit
According to CoinShares, a large share of institutional ETF positions was built in the first quarter of 2026
in the 52,000 to 58,000 USD range. That matters for two reasons:
Break-even is near: At a price around 63,500 USD, the addresses that entered most recently are only barely in profit. That explains the selling pressure from nervous hands.
Structural support: This cost-basis zone overlaps almost exactly with the Power Law support at roughly 58,000 USD. Two independent methods point at the same area.
Interpretation: Below this zone, Bitcoin turns into a loss for most buyers of the past few months, historically the region where supply runs dry.
4) Valuation Model: The Power Law
Let's step away from the daily price and look at the mathematics of the growth curve. The live values come from
our own Power Law tool:
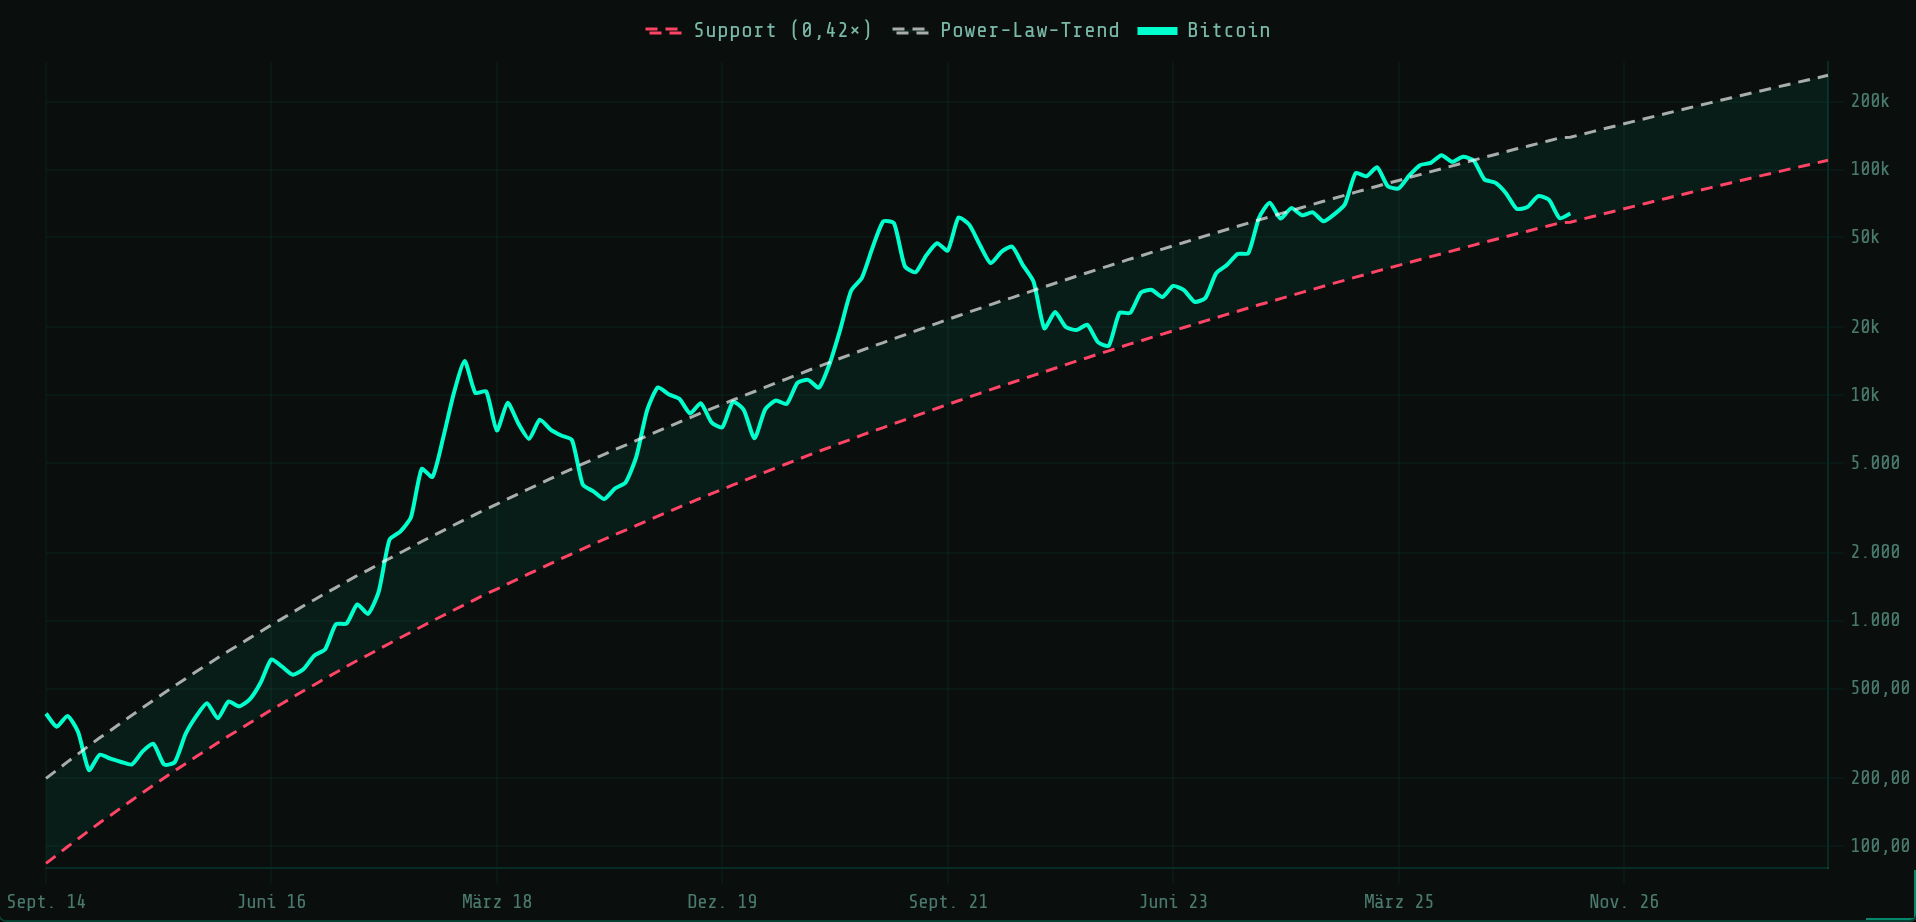
Deviation from trend: The price is around 54 percent below the fair model
trend of roughly 139,000 USD. The gap was last this wide after the FTX collapse.
Corridor position: About 10 percent, meaning the price sits almost directly
on the support line (around 58,000 USD), not in the middle of the corridor.
The tool's verdict: "At support, historic buy zone." This is exactly where the cycle bottom
formed in November 2022, precisely at 0.42 times the trend.
Bitcoin in the Power Law corridor (log scale): white line = fair model trend, red line = support (trend × 0.42). Snapshot of our live charts.
What Is the Power Law?
Plot the Bitcoin price on a double-logarithmic scale against time since the genesis block (January 3, 2009), and for over 15 years it has stayed remarkably close to a straight line. A straight line in a log-log chart means the price grows according to a power law, not exponentially, but flattening over time while still climbing. The trend (white) is the fair model value the price oscillates around in cycles: sometimes far above it (euphoria), sometimes well below (bear market). The support (red, trend × 0.42) is the lower corridor boundary that no bear-market bottom has ever broken sustainably.
Right now the price sits at a corridor position of about 10 percent, almost directly on the support and 54 percent below the fair trend. Historically, these were exactly the zones where patient accumulation paid off. One warning belongs here: the support rises with the model by roughly 2.8 percent per month. If the price just moves sideways, the support line catches up within weeks, and then the model gets tested. The power law is a statistical observation, not a law of nature. It describes the past well, but it is no guarantee for the future. Use it as a map for orientation, not as a promise.
5) On-Chain Forensics: Near Fair Value
What do the chain data say beyond the daily price?
MVRV Z-Score (~0.3 – 0.4): The ratio of market value to realized value sits near the fair range. No sign of overheating, the speculative air is gone.
NUPL (~0.28): The share of unrealized profit in the network has dropped into the hope-and-fear zone. Such readings do not mark tops, but rather transitions toward bottom formation.
Institutions: According to CoinShares, professional ETF holders cut their positions by 17 percent in the first quarter of 2026 (from roughly 313,000 to 261,000 BTC), with the dollar value down 35 percent to 17.8 billion USD. Notably, US banks added against the trend.
6) Market Structure: Record ETF Outflows
The selling pressure clearly comes from the ETF wrapper:
13-day outflow streak: From May 15 to June 3, around 4.4 billion USD left crypto ETFs across the board, the longest outflow streak since the ETF launch in 2024. The largest Bitcoin ETF alone lost about 3.3 billion USD.
Biggest single week: In the worst week, investors pulled around 3.4 billion USD from US spot Bitcoin ETFs, the largest weekly outflow of the year.
Symbolic impact: Even Strategy (MSTR) sold 32 Bitcoin for 2.5 million USD in late May, its first sale since December 2022. Immaterial in size, but a psychological break of the "never sell" doctrine.
7) Network Check: The Physical Truth (Hashrate)
While the price falls, the energy in the network remains enormous. The hashrate sits at roughly 777 EH/s and difficulty at 138.96 trillion.
The signal: The network is securing value with massive physical energy, undisturbed by price. Miners do not switch off their machines because the price twitches. The fundamental integrity stays unshakeable.
8) Buy Ranges: A Strategic Framework
Based on the data, the following scenarios emerge for the rational owner:
Scenario A – Holding the support (58k – 66k USD):
The model scenario. The price defends the Power Law support and the Q1 institutional cost-basis zone. Sideways until the outflows dry up. Ideal for DCA.
Scenario B – Break of the support (below 58k USD):
If the price falls sustainably below support and the Q1 cost-basis zone, a bearish acceleration looms, and the Power Law itself would be put to the test. No model guarantees a return.
Scenario C – The turn (above 70k USD):
If the ETF outflows end and demand returns, the path back toward the trend opens up. The 54 percent gap to the fair model value is then fuel.
Risk Warning: The Power Law support at around 58,000 USD is the critical line. If it breaks on a weekly close, the bearish risk is substantial, and no model promises a return. Never use leverage in this environment. Spot only, cold storage only.
Tools for Real Owners
If you want to hold Bitcoin as self-sovereignly as possible, don't use your bank's brokerage account:
Buy Bitcoin in Europe – 21bitcoin:
Bitcoin-only app from Europe, ideal for DCA and stacking sats regularly — no shitcoins.
Use code ALIENINVESTOR for a permanent 0.2 percentage point fee reduction
on instant and savings plan purchases. https://alien-investor.org/21bitcoin
₿ Bitcoin in self-custody:
Hardware wallet instead of exchange account. I use the BitBox — there is the classic BitBox02 and the new
BitBox for iPhone (Nova). https://alien-investor.org/bitbox
Privacy & Mail:
For email, VPN, and cloud I use Proton — data-minimal and without Big Tech dependency. https://alien-investor.org/proton
Note: Some of the links above are affiliate links. Using them supports my work at no extra cost to you. Thanks!
Sources (Selection)
Price and Power Law values come from our own charts tool (api.alien-investor.org). On-chain data (MVRV Z-Score, NUPL), ETF flows (CoinShares 13F, CoinGlass), hashrate (CoinWarz), and the Crypto Fear & Greed Index were cross-checked against independent sources. As of: June 8, 2026.