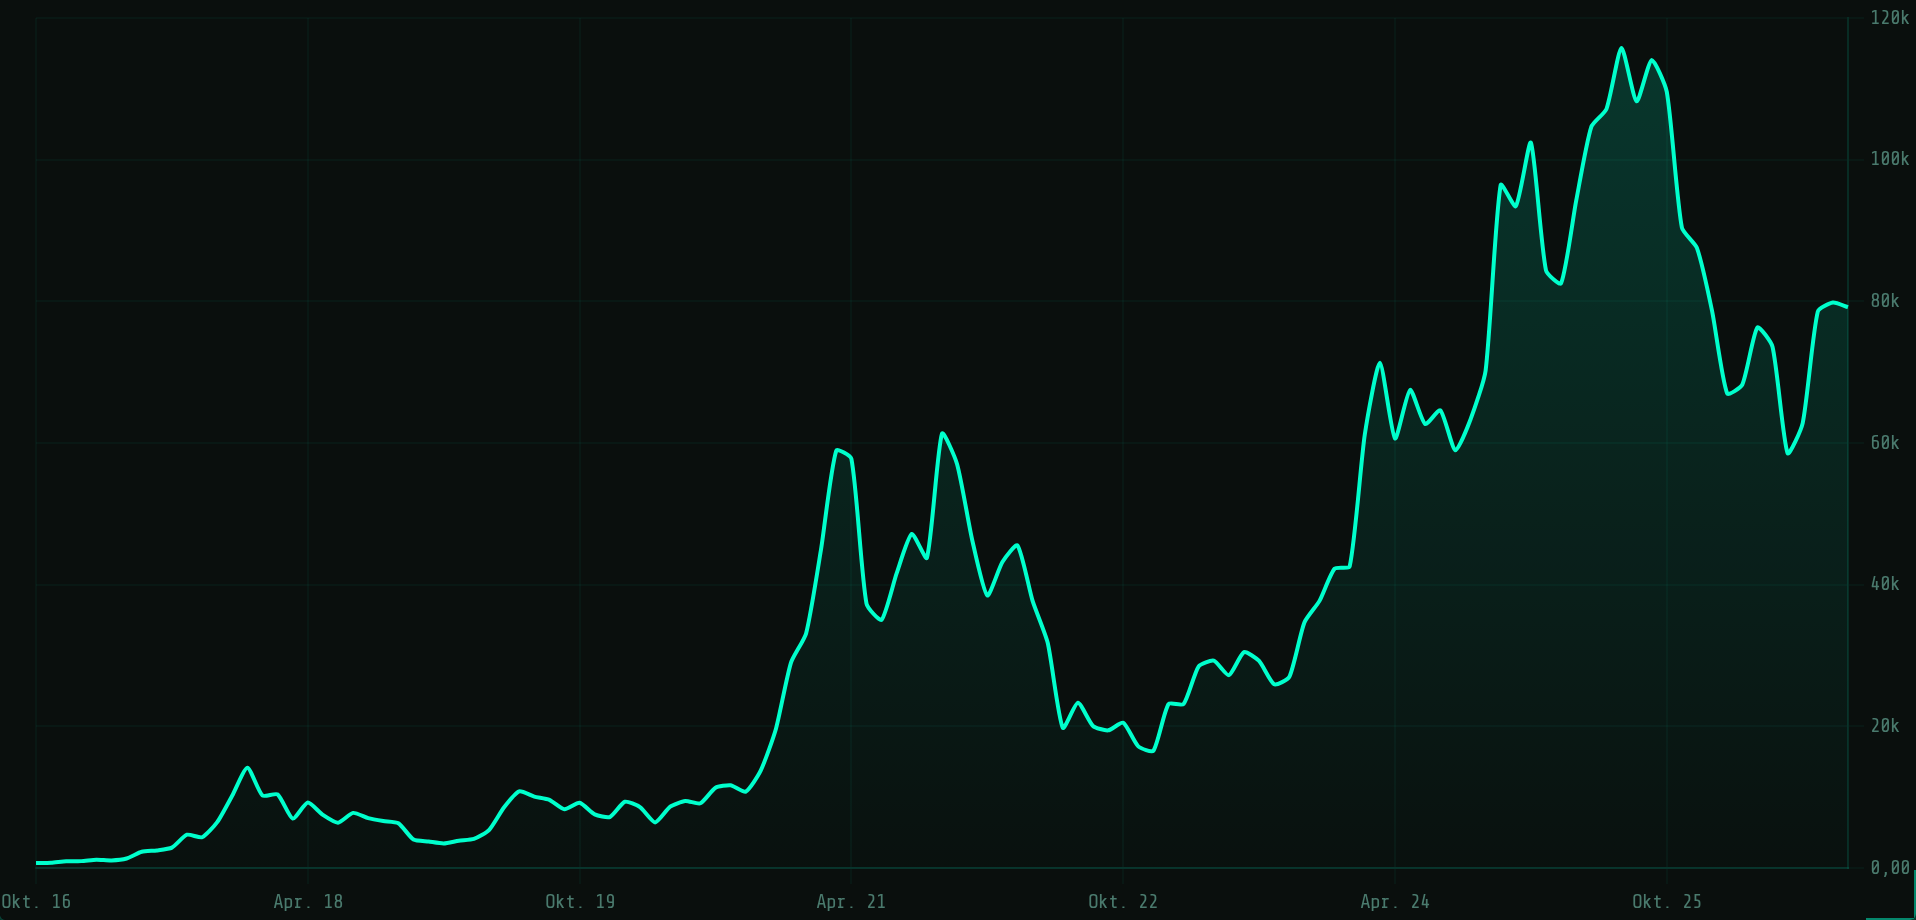
Three months after the capitulation, the world looks different. On June 25, Bitcoin ticked down to 58,000 USD, its lowest level since autumn 2024, and closed June just above that. That is exactly where the support line of our Power Law corridor ran at the time. It held. Since then the price has risen by roughly a third and sits today at about 79,200 USD. The spot ETFs had their strongest month of the year in August, and the Crypto Fear & Greed Index has flipped from 8 (extreme fear) to 71 (greed). And yet: the price still sits 48 percent below the fair model trend. So the interesting question is not whether the bottom was in, but what stands between here and the trend line. A Fed that is contemplating rate hikes, for example.
"This analysis deconstructs the discrepancy between price and value. It is not a buy recommendation, but a tool for orientation in the four-dimensional space of time, price, adoption, and energy."
The Power Law support marked the cycle bottom in June to the dollar, Bitcoin has since run from 58,000 to around 79,000 USD and now sits in the lower third of the corridor at a 25 percent position: no longer the bargain zone of June, but with a 48 percent gap to the fair trend still a long way from euphoria.
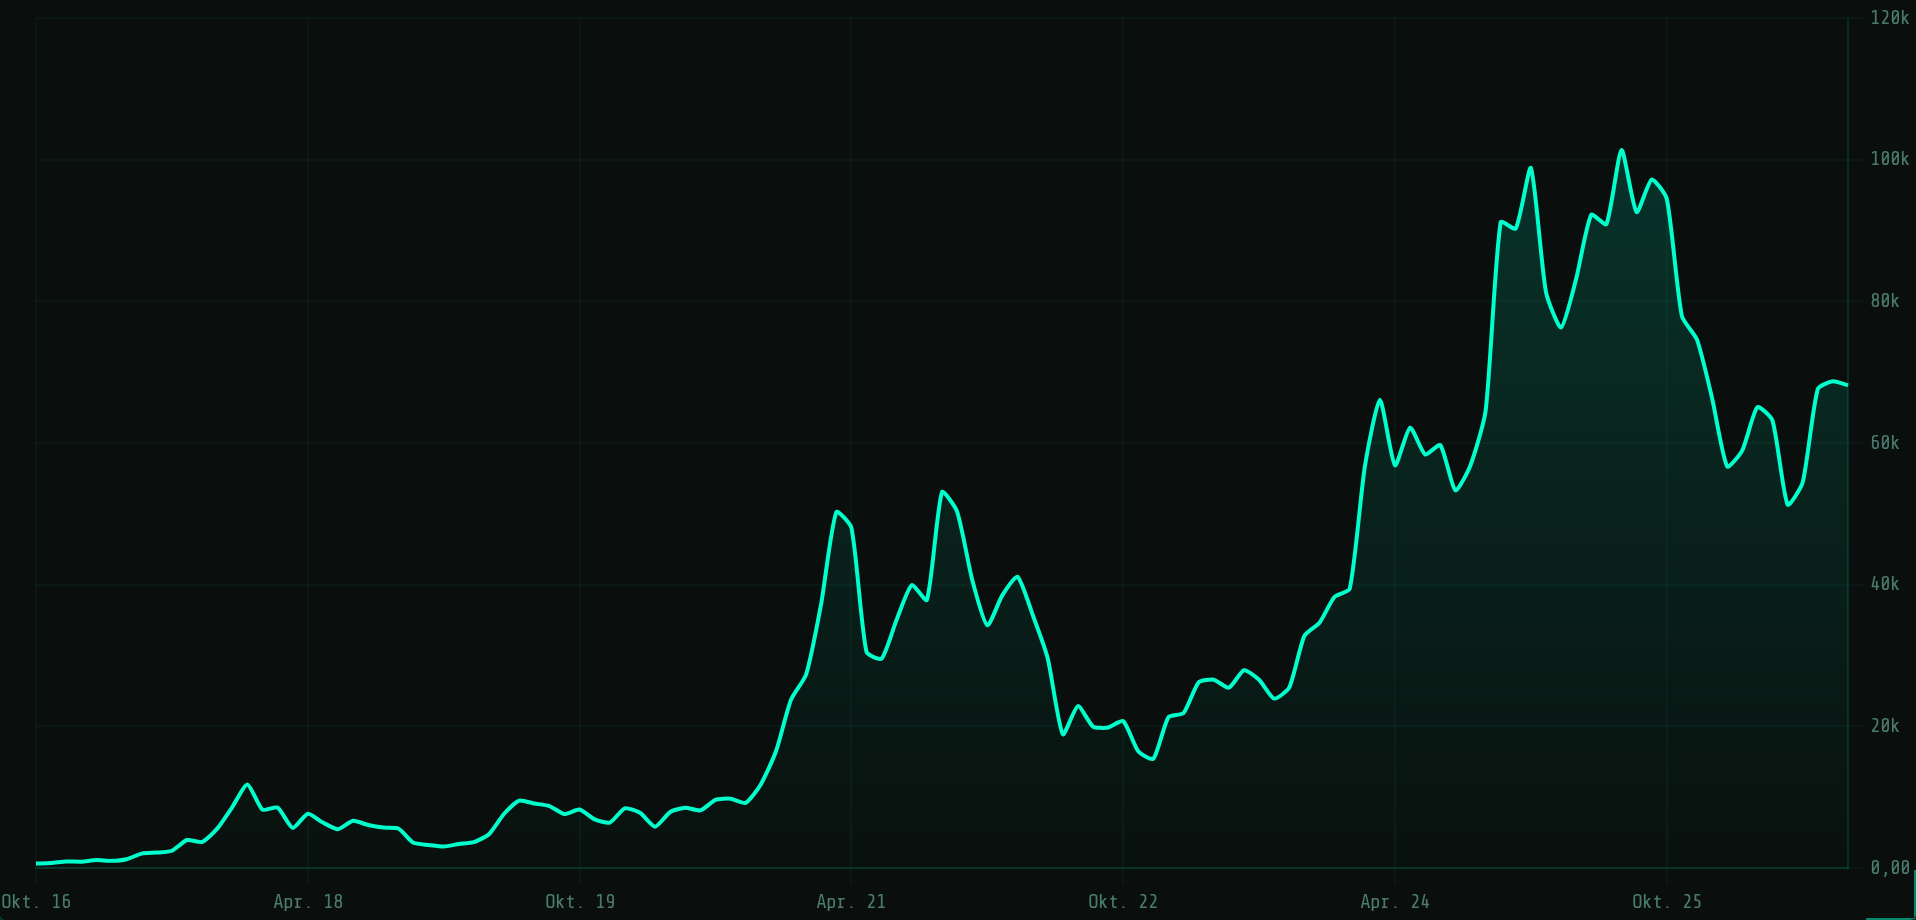
The macro picture has not improved since June, it has only shifted. Back then, risk-off was the trigger of the sell-off. Today the US central bank faces a decision the market long considered unthinkable: a rate hike.
Worth noting: Equity markets sold off on the strong jobs data, Bitcoin did not. The price held 79,000 USD while the S&P 500 slipped. That is not a trend yet, but a hint that ETF demand currently outweighs the rate scare. The real test comes with the inflation prints on September 10 and 11 and the Fed decision one week later.
Honesty is part of the job: gold has been the better investment in 2026 so far. The ounce trades at roughly 4,400 to 4,450 USD, so one Bitcoin buys about 17.8 ounces. At the all-time high in October 2025 it was still around 32 ounces. Bitcoin has therefore lost almost half of its value against gold, even though both assets live off the same distrust of the fiat system.
For the long-term owner this is no reason to reshuffle, but a piece of information: in phases where Bitcoin trades like a tech stock, the old money wins. In phases where scarcity matters, the ratio turns. Historically, lows in the ratio were not sell signals but buy signals for Bitcoin.
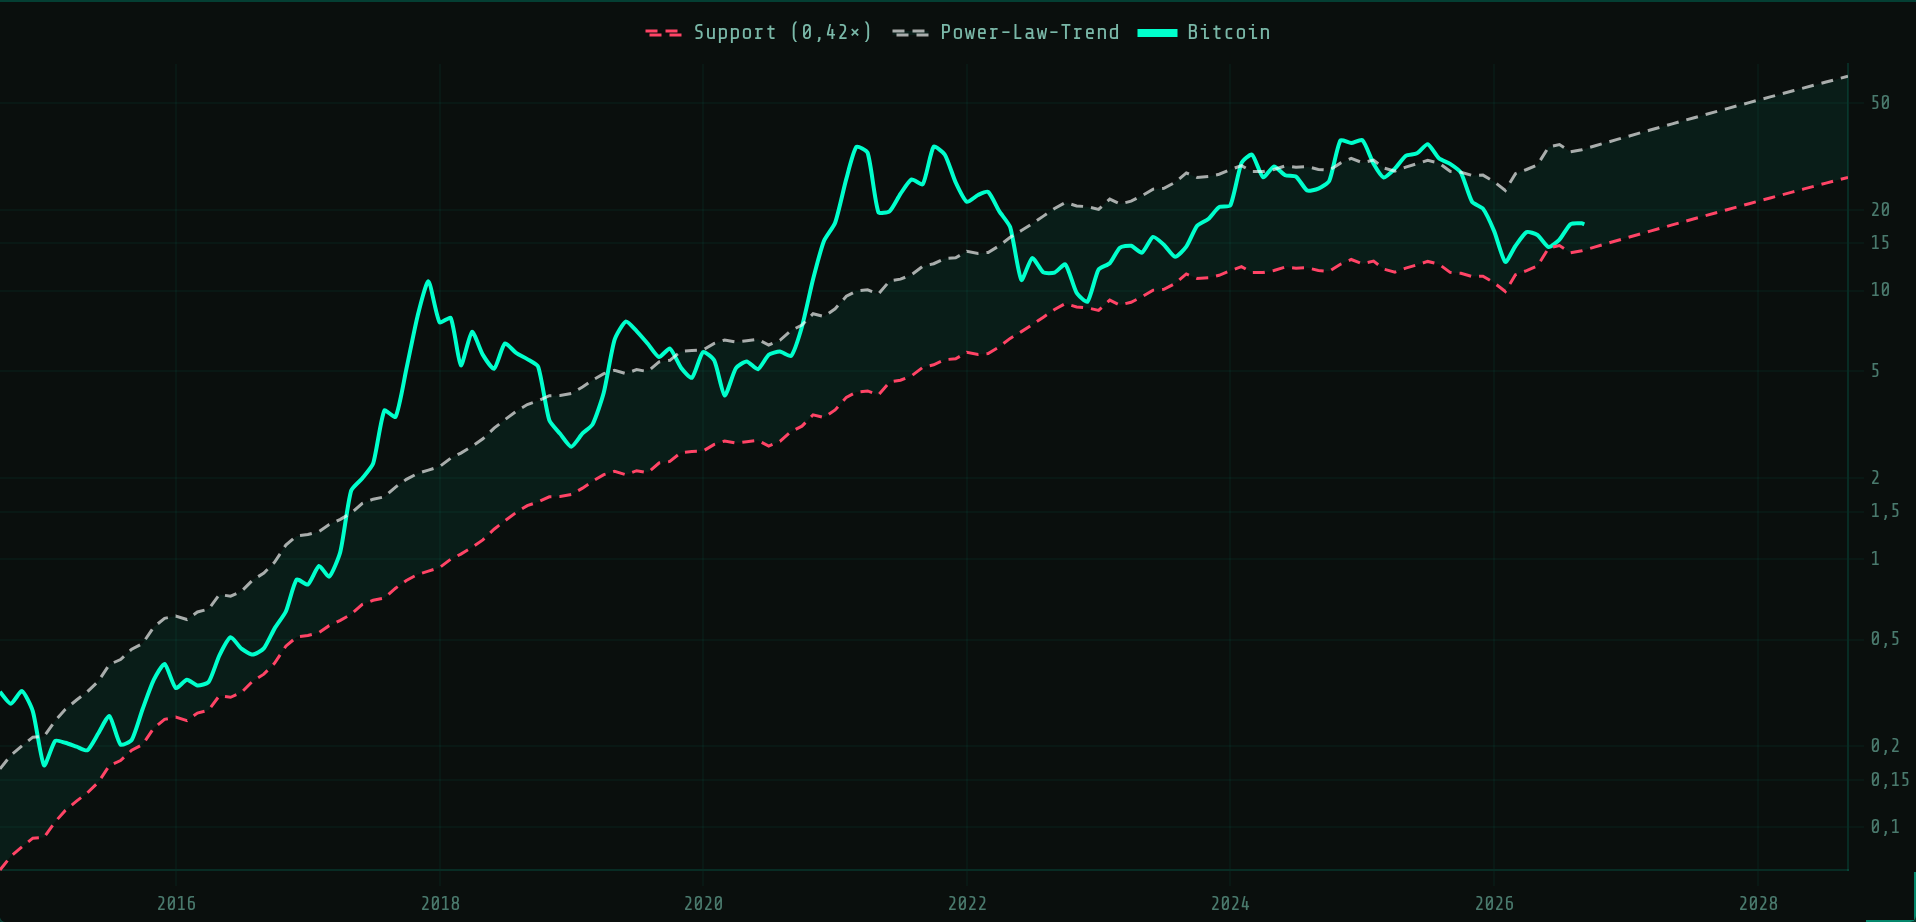
Our Power Law tool can draw the corridor in gold instead of dollars. The picture is more sobering than in USD: because gold itself has climbed steeply since 2024, the trend line in ounces has run almost flat for two years, and at the June low Bitcoin measured in gold briefly slipped below the support, which did not happen in dollars. Today the price sits at 17.7 ounces, the support at around 14 ounces, the model trend at around 34 ounces. At the all-time high in October 2025, Bitcoin at roughly 32 ounces was therefore practically on the gold trend, not above it. Deviation and corridor position are identical to the dollar view (48 percent below trend, 25 percent corridor) because both quantities are divided by the same gold price.
Let us step away from the daily price and look at the mathematics of the growth curve. The live values come from our own Power Law tool:
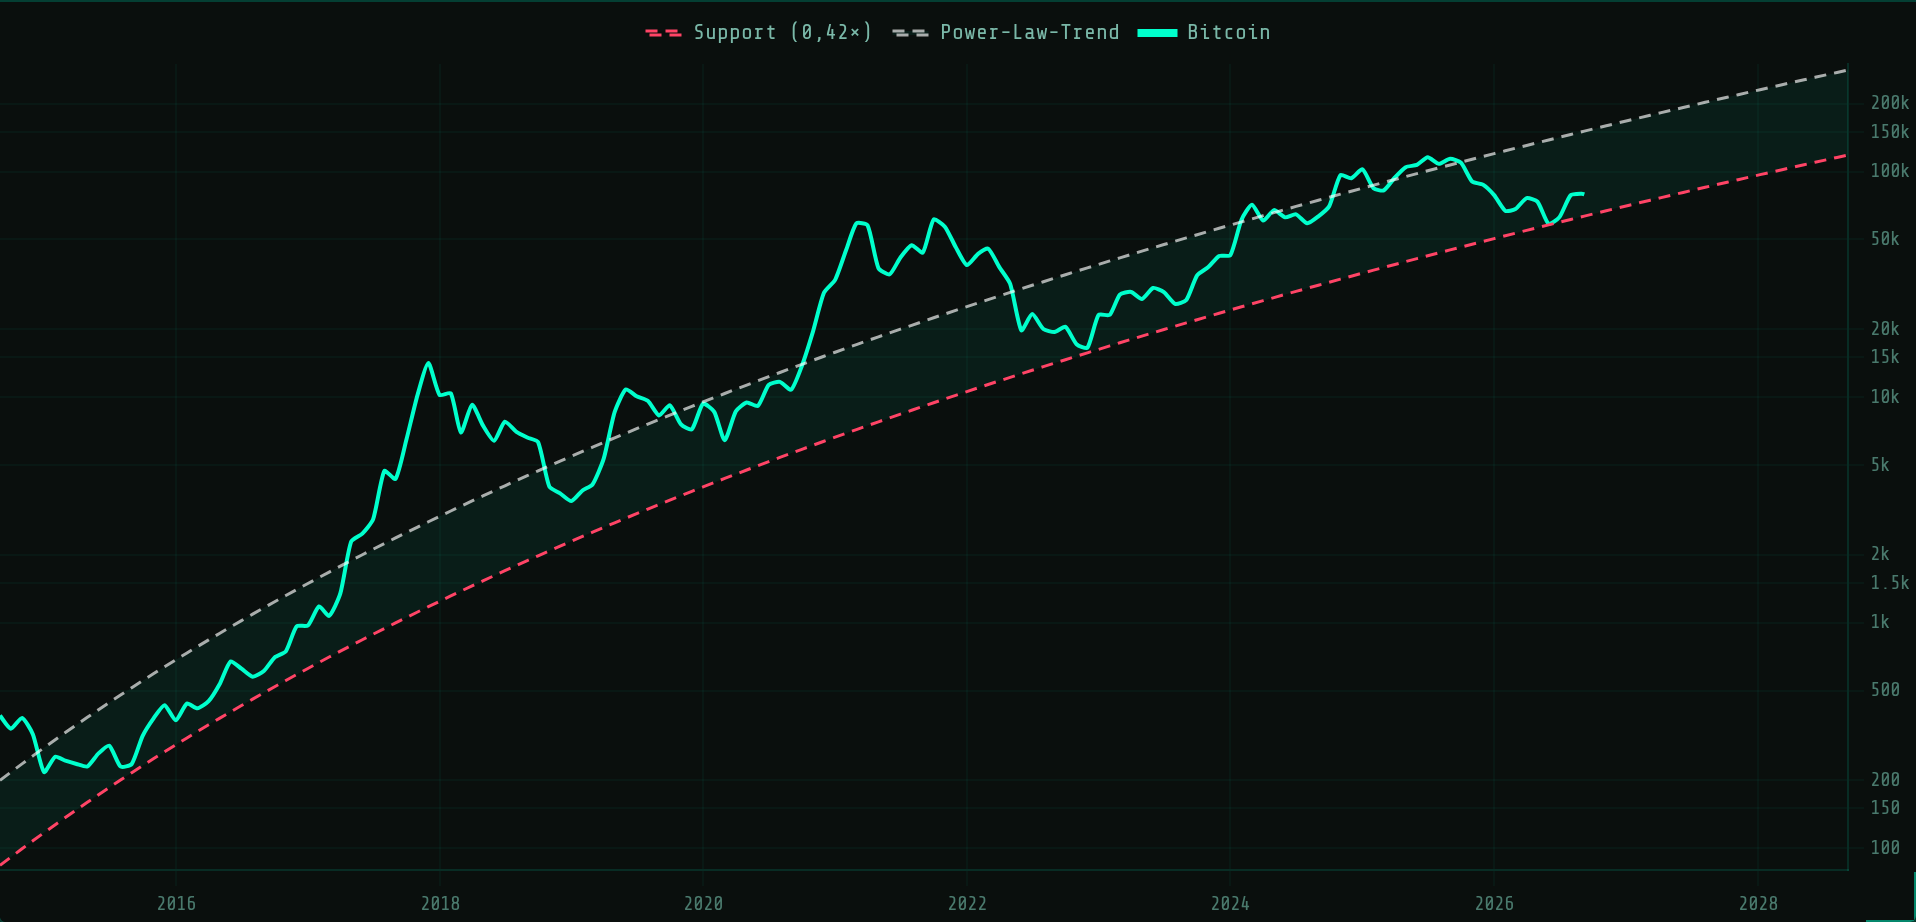
Plot the Bitcoin price on a double-logarithmic scale against time since the genesis block (January 3, 2009), and for over 15 years it has stayed remarkably close to a straight line. A straight line in a log-log chart means the price grows according to a power law, not exponentially, but flattening over time while still climbing. The trend (white) is the fair model value the price oscillates around in cycles: sometimes far above it (euphoria), sometimes well below (bear market). The support (red, trend × 0.42) is the lower corridor boundary that no bear-market bottom has ever broken sustainably.
Right now the price sits in the lower third at a corridor position of about 25 percent and 48 percent below the fair trend. That is no longer the extreme zone of June, but still a region from which history shows more upside than downside. Two things belong here: first, the support keeps rising by about 2.8 percent per month, so a return to the red line would already cost more today than it did in June. Second, the power law is a statistical observation, not a law of nature. It describes the past well, but it is no guarantee for the future. Use it as a map for orientation, not as a promise.
What do the chain data say beyond the daily price?
In June I wrote that the selling pressure clearly came from the ETF wrapper. Three months later, the buying pressure comes from there:
The reading: The same products that triggered the sell-off in May and June are now buying back at prices 20 percent higher. That is not a sign of foresight but of momentum capital. Those who bought at the bottom are sitting better today than the addresses that waited for the green candle.
The summer was hard on miners. Difficulty has been cut ten times and raised eight times in 2026, netting out
roughly 13 percent below the start of the year. It began the year at 146 trillion and now stands at
127.45 trillion after a small 1.3 percent increase on September 5. The seven-day average
hashrate sits at roughly 934 EH/s, up from 777 EH/s in June. The record of around 1.3 ZH/s
(daily value) from October 2025 has not been reclaimed yet.
The signal: With the price rise, hashprice, the revenue per unit of computing power, has climbed
roughly 22 percent in 30 days. Machines that were switched off in June are coming back online. The network
cushioned the miner capitulation with difficulty cuts, exactly as designed. No outage, no emergency plan, just the
algorithm.
On Sunday, September 6, roughly 4,000 BTC (about 320 million USD) were withdrawn from the federation wallet of the Liquid Network. The cause was a bug in the Elements software (confidential transactions, rangeproof cache) that allowed unbacked L-BTC to be minted. The peg-out itself went through the regular 11-of-15 federation threshold, no key was stolen. The sidechain was paused, and exchanges halted L-BTC deposits and withdrawals. The actors call themselves "whitehats" and, after the patch, sent roughly 3,400 BTC back on September 7. They are keeping about 600 BTC (around 47 million USD) as a "bounty".
The lesson does not depend on the outcome: The Bitcoin blockchain was never affected. What was affected is a sidechain token whose security rests on a group of signers and on software that is not Bitcoin. L-BTC is a promise of Bitcoin, not Bitcoin. The same applies to every wrapped token, every sidechain and every "Bitcoin account" at a provider. If you do not hold the key, you hold a promise.
Based on the data, the following scenarios emerge for the rational owner:
If you want to hold Bitcoin as self-sovereignly as possible, don't use your bank's brokerage account:
Note: Some of the links above are affiliate links. Using them supports my work at no extra cost to you. Thanks!
Price and Power Law values come from our own charts tool (api.alien-investor.org). ETF flows (Farside, SoSoValue), on-chain data (Glassnode, Santiment), hashrate and difficulty (CoinWarz, mempool.space), Fed data (federalreserve.gov, BLS), the Liquid incident (Blockstream, Protos) and the Crypto Fear & Greed Index (alternative.me) were cross-checked against independent sources. As of: September 7, 2026.
Thanks for your support — for free content, financial sovereignty, and the extraterrestrial resistance!