Bitcoin trades at roughly half its all-time high of $126,080. The timeline is full of crash prophets and hopium, depending on the camp. Both are noise. There is, however, one model that gives a measurable answer to the same question: the power law. And right now its answer is remarkably specific. The price sits almost exactly on the line that has held every single bear market bottom since 2011.
What Is the Power Law?
Plot the Bitcoin price against time since the genesis block (January 3, 2009) on a double-logarithmic scale, and for over 15 years it has stayed remarkably close to a straight line. A straight line in a log-log chart means the price grows according to a power law. Not exponentially, but flattening over time while still climbing.
The widely used calibration of the model, popularized by physicist Giovanni Santostasi:
price ≈ 1.0117·10⁻¹⁷ × d5.82 (d = days since the genesis block)
The common explanation behind it: Bitcoin grows like a network. More users make the network more valuable, and the higher value attracts new users. Feedback loops like this produce power laws in many systems, from cities to social networks. Whether the explanation is correct remains open. That the curve has fit so far is measurable.
The Corridor: Trend and Support
The formula yields two lines that together form the power law corridor:
- Trend line: the model's fair value. The price oscillates around this line in cycles, sometimes far above, sometimes well below.
- Support: trend line × 0.42. No bear market bottom has ever broken this line sustainably. The cycle bottom in November 2022 (around $15,700) landed exactly on 0.42× trend.
There is deliberately no fixed upper boundary. Cycle tops keep landing closer to the trend line each cycle, and a reliable resistance line simply does not exist:
| Cycle top | Price relative to the trend line |
|---|---|
| December 2017 | 6.8× above trend |
| November 2021 | 2.9× above trend |
| 2025 (ATH $126,080) | 1.2× above trend |
This convergence is an observation in its own right: the euphoria spikes are shrinking, and the price hugs the model ever more closely. If that continues, it points to declining volatility. Bitcoin is maturing.
Where the Price Stands Today
As of June 6, 2026, day 6,363 since the genesis block:
- Price: around $60,300
- Power law trend: $138,848 (price sits 56.5% below it)
- Support: $58,316 (price sits just a few percent above it)
- Corridor position: 4% (0% = support, 100% = trend line)
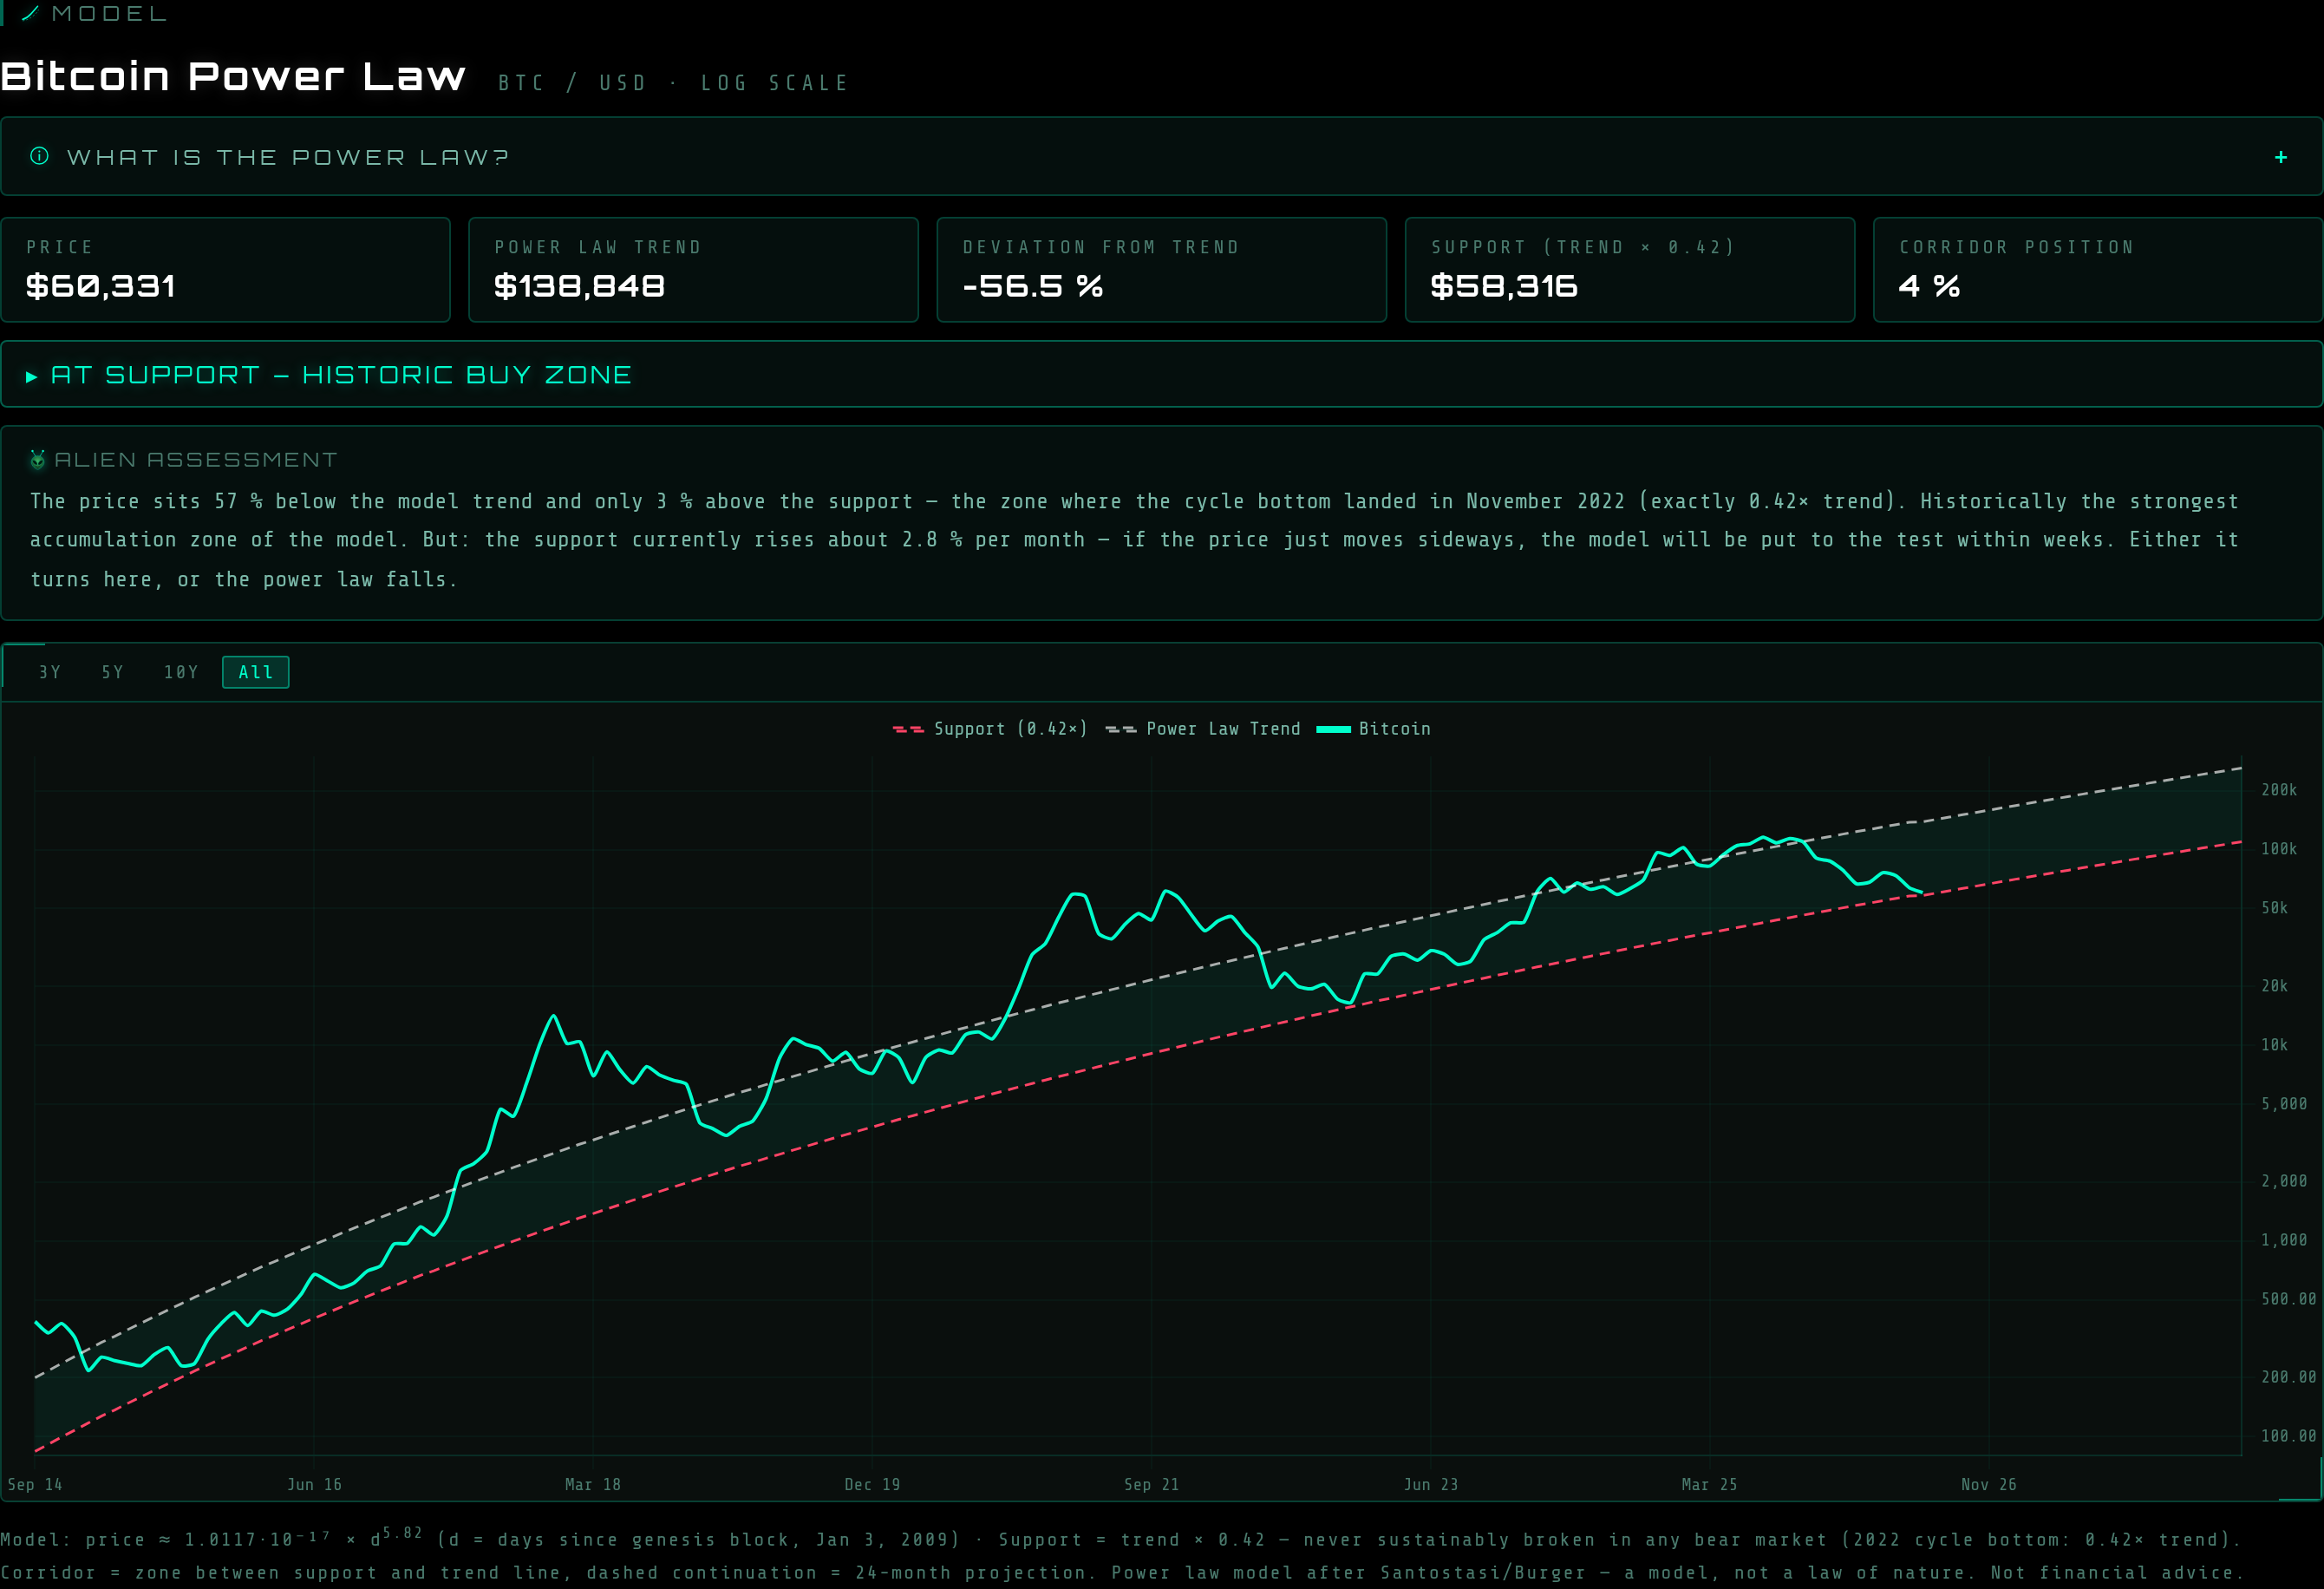
The new power law chart on alien-investor.org: price (green), trend line (white dashed), support (red dashed). Status: AT SUPPORT.
Translated: the price trades in the zone where the last major bottom formed in November 2022. Historically, this exact zone was the model's strongest accumulation area. Everyone who bought in this zone was right in hindsight. So far.
The Catch: The Support Doesn't Wait
What many overlook: the support line is not a horizontal mark like a classic chart level. It rises along with the model, currently about 2.8% per month, roughly 38% per year. That has an uncomfortable consequence: there is no comfortable grinding along the bottom. If the price just moves sideways for a few weeks, the support catches up with it.
Which means the model faces its hardest test since 2022. Either the price turns up in this zone, as it did in every previous cycle. Or the power law gets falsified live over the coming months.
What the Model Cannot Do
The power law is a statistical observation across roughly 6,400 days, not a law of nature. Three things belong in any honest assessment:
- The exponent depends on the data window. Newer estimates sit closer to ~5.7 than 5.82. The model is a curve fit, not a derivation.
- It knows nothing about shocks. Regulation, macro crises, black swans: none of that lives in a formula.
- A break of the support would not be a buy signal. It would simply mean the model was wrong. Not that the price has to come back.
Anyone reading the model as a guarantee has misunderstood it. Anyone using it as a map for orientation gets something rare: a sober benchmark in a market that runs on mood.
Check It Yourself: Live and Free
That is exactly why the power law model is now a permanent part of the Alien Investor tools. No signup, no tracking, calculated live on every page load:
- The power law chart: price since 2014 on a log scale, trend line, support, corridor, and a projection 24 months into the future. Plus a collapsible explanation of the model and an automatic Alien Assessment that adapts to the current situation.
- Mission Control: the power law card right on the dashboard, next to prices, Fear & Greed and markets.
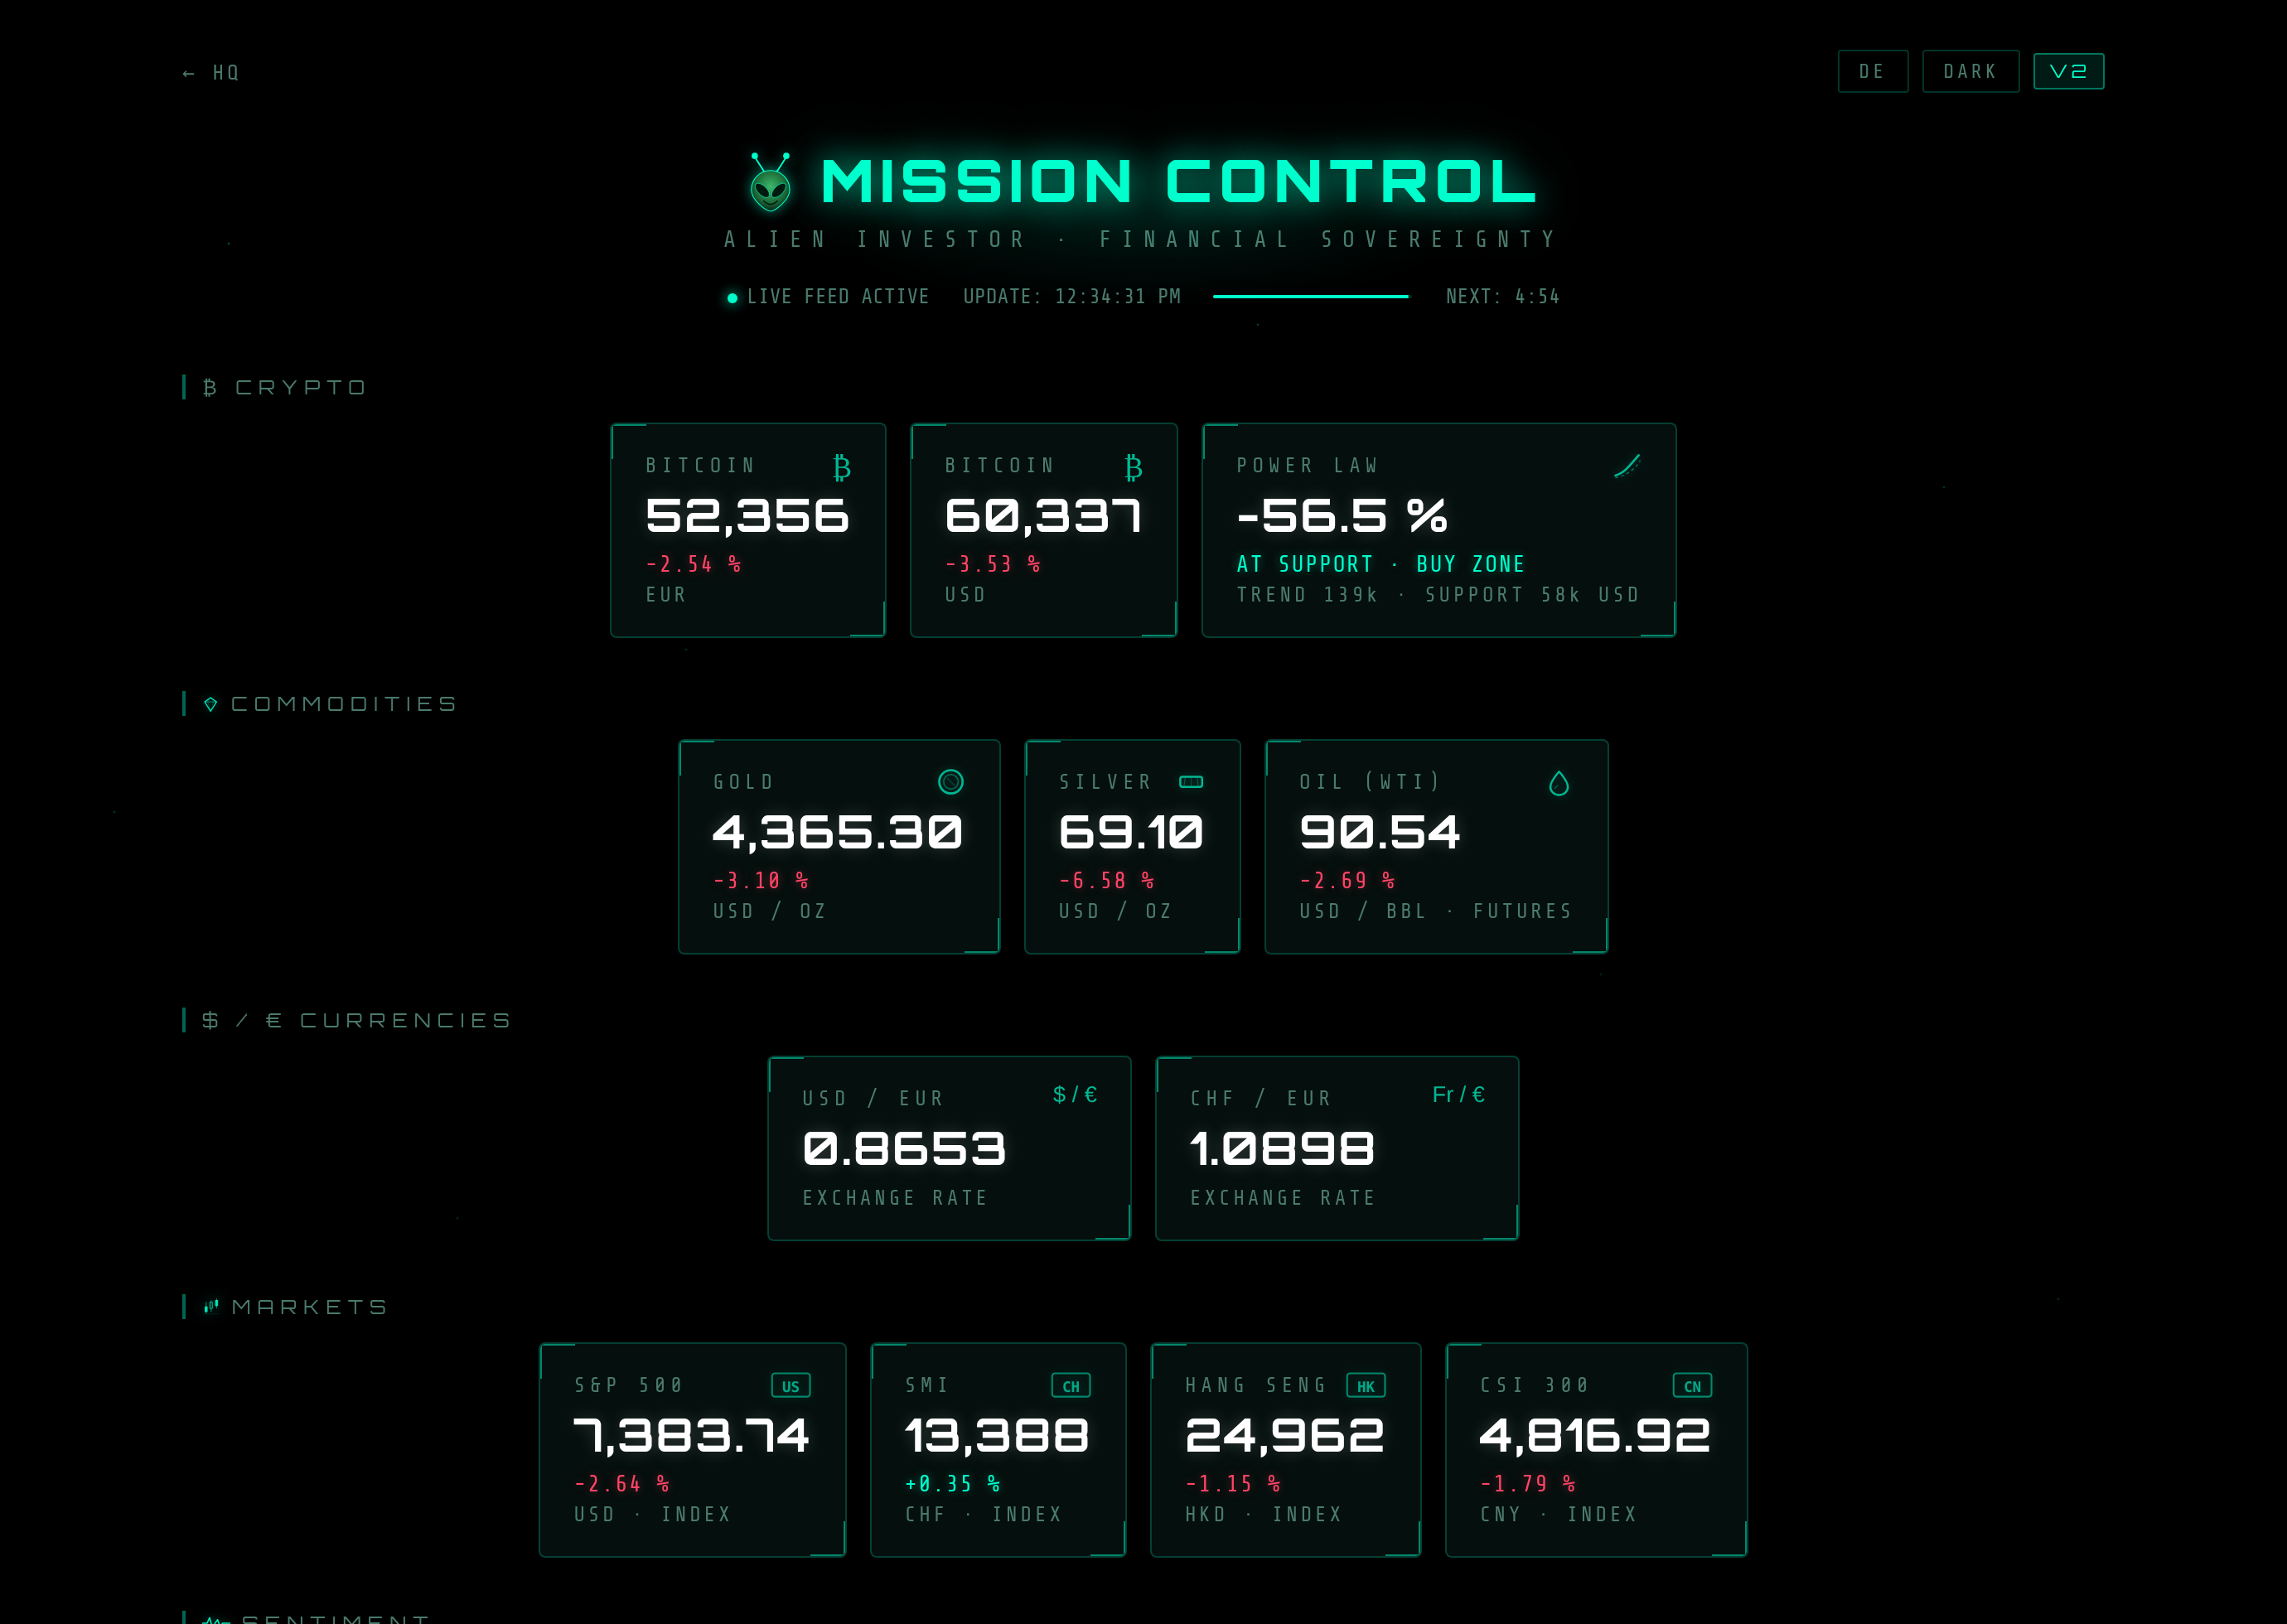
Mission Control with the new power law card: deviation from trend, verdict and the key model values at a glance.
Both tools are bilingual (EN/DE toggle) and always show the current state. The numbers in this article are a snapshot from June 6, 2026. What the corridor says today, you can see there.
Conclusion
Is the bottom in? The power law says: if the model continues to hold, then yes, roughly here. The zone where the price currently trades is where bear markets have historically ended. At the same time, the support keeps rising month after month and leaves the price little time for indecision.
So the honest answer is: the model's bottom is practically reached. Whether it is the actual bottom will be decided by the market over the coming weeks. Either way, the corridor delivers what moods never do: a benchmark you can verify.
Models are maps, not contracts. But whoever travels without a map ends up following the mood of the crowd.
Further Reading
- How I Evaluate the Bitcoin Price — models and metrics at a glance
- Self-Custody: Why Bitcoin Without Your Own Keys Loses Its Point
- Bisq: Buying Bitcoin Without KYC — the decentralized alternative to exchanges
- Bitcoin Without KYC 2026 — the complete overview
Tools for Real Owners
-
📖 GrapheneOS: Android in the Age of Surveillance
Setup, apps & digital sovereignty — the complete guide to your Google-free Android. DRM-free.
alien-investor.org/buecher.html · also on Amazon KDP -
Privacy & Email: Email, VPN and cloud without Big Tech — Proton.
alien-investor.org/proton -
₿ Bitcoin in Self-Custody: Hardware wallet instead of exchange account. Code
ALIENINVESTOR= 5% discount on the BitBox.
alien-investor.org/bitbox -
₿ Buy Bitcoin (Europe): Bitcoin-only, no altcoin noise. Code
ALIENINVESTOR= permanent −0.2 percentage points in fees.
alien-investor.org/21bitcoin