No phosphate and potash, no grain. No grain, no 8 billion people. The Mosaic Company sits at one of the few genuine geological bottlenecks in the modern food supply chain — and still trades below book value. The question isn't whether it's cheap, but why.
"Mosaic sells the foundation of agriculture. No fertilizer — no food. That's not hype, that's chemistry."
1) Quick Overview
| Metric | Value |
|---|---|
| Ticker | MOS (NYSE) |
| Price (April 2026) | $26.54 |
| Market Capitalization | $8.4B |
| P/E Ratio (trailing) | 15.6× |
| EPS (TTM) | $1.70 |
| P/B Ratio | 0.70 — below book value |
| Dividend Yield | 3.32% |
| Sector | Basic Materials / Agricultural Inputs |
Mosaic is the world's largest integrated phosphate producer and one of the four largest potash producers globally. The company supplies global agriculture with the two nutrients no modern farming can replace — and controls the value chain from mine to ship.
2) Business Model & Segments
Three segments, one logic: extract raw materials from the ground, refine them, deliver to the farmer.
- Phosphates — Mining in central Florida (one of the few economically viable phosphate deposits in the western hemisphere), processing into DAP, MAP and the premium product MicroEssentials®. MicroEssentials is ammoniated and slower-releasing than standard product — higher margin, less commodity dependency.
- Potash — Potash mining in Saskatchewan, Canada. One of the lowest-cost production sites in the world. Saskatchewan is geological luck: large-scale, deep, high-grade.
- Mosaic Fertilizantes — Production and distribution in Brazil, the world's largest agricultural import market. Direct access to Brazilian farmers through a proprietary distribution network.
The full value chain: Own mines → own processing plants in Florida, Louisiana and Brazil → own logistics by rail, inland waterway and ocean freight. No external dependency, no middleman.
The moat: Phosphate mines in Florida don't get built on demand. Constructing a new mine costs billions and takes 10–15 years. Resource ownership is the moat — no patent, no network effect, just geology. OCP (Morocco, state-owned) is the only player that can structurally pressure Mosaic's phosphate business — more on that under Risks.
3) Growth & Development
| Year | Revenue | EPS | Op. Margin |
|---|---|---|---|
| 2021 | $12.4B | $4.27 | 20.0% |
| 2022 ▲ Peak | $19.1B | $10.06 | 25.0% |
| 2023 | $13.7B | $3.50 | 9.8% |
| 2024 ▼ Trough | $11.1B | $0.55 | 5.6% |
| 2025 | $12.1B | $1.70 | 6.8% |
Why the collapse after 2022? The war in Ukraine temporarily knocked Russia and Belarus out as fertilizer exporters. Potash, phosphate and nitrogen spiked simultaneously to record prices. Mosaic earned ten times more per share in 2022 than today. 2023–2025 brought normalization. The earnings decline of -43% p.a. over three years is not a sign of structural weakness — it's cycle normalization after a historically exceptional year.
That's the central read for everything that follows: every metric based on earnings is optically distorted at the cycle trough.
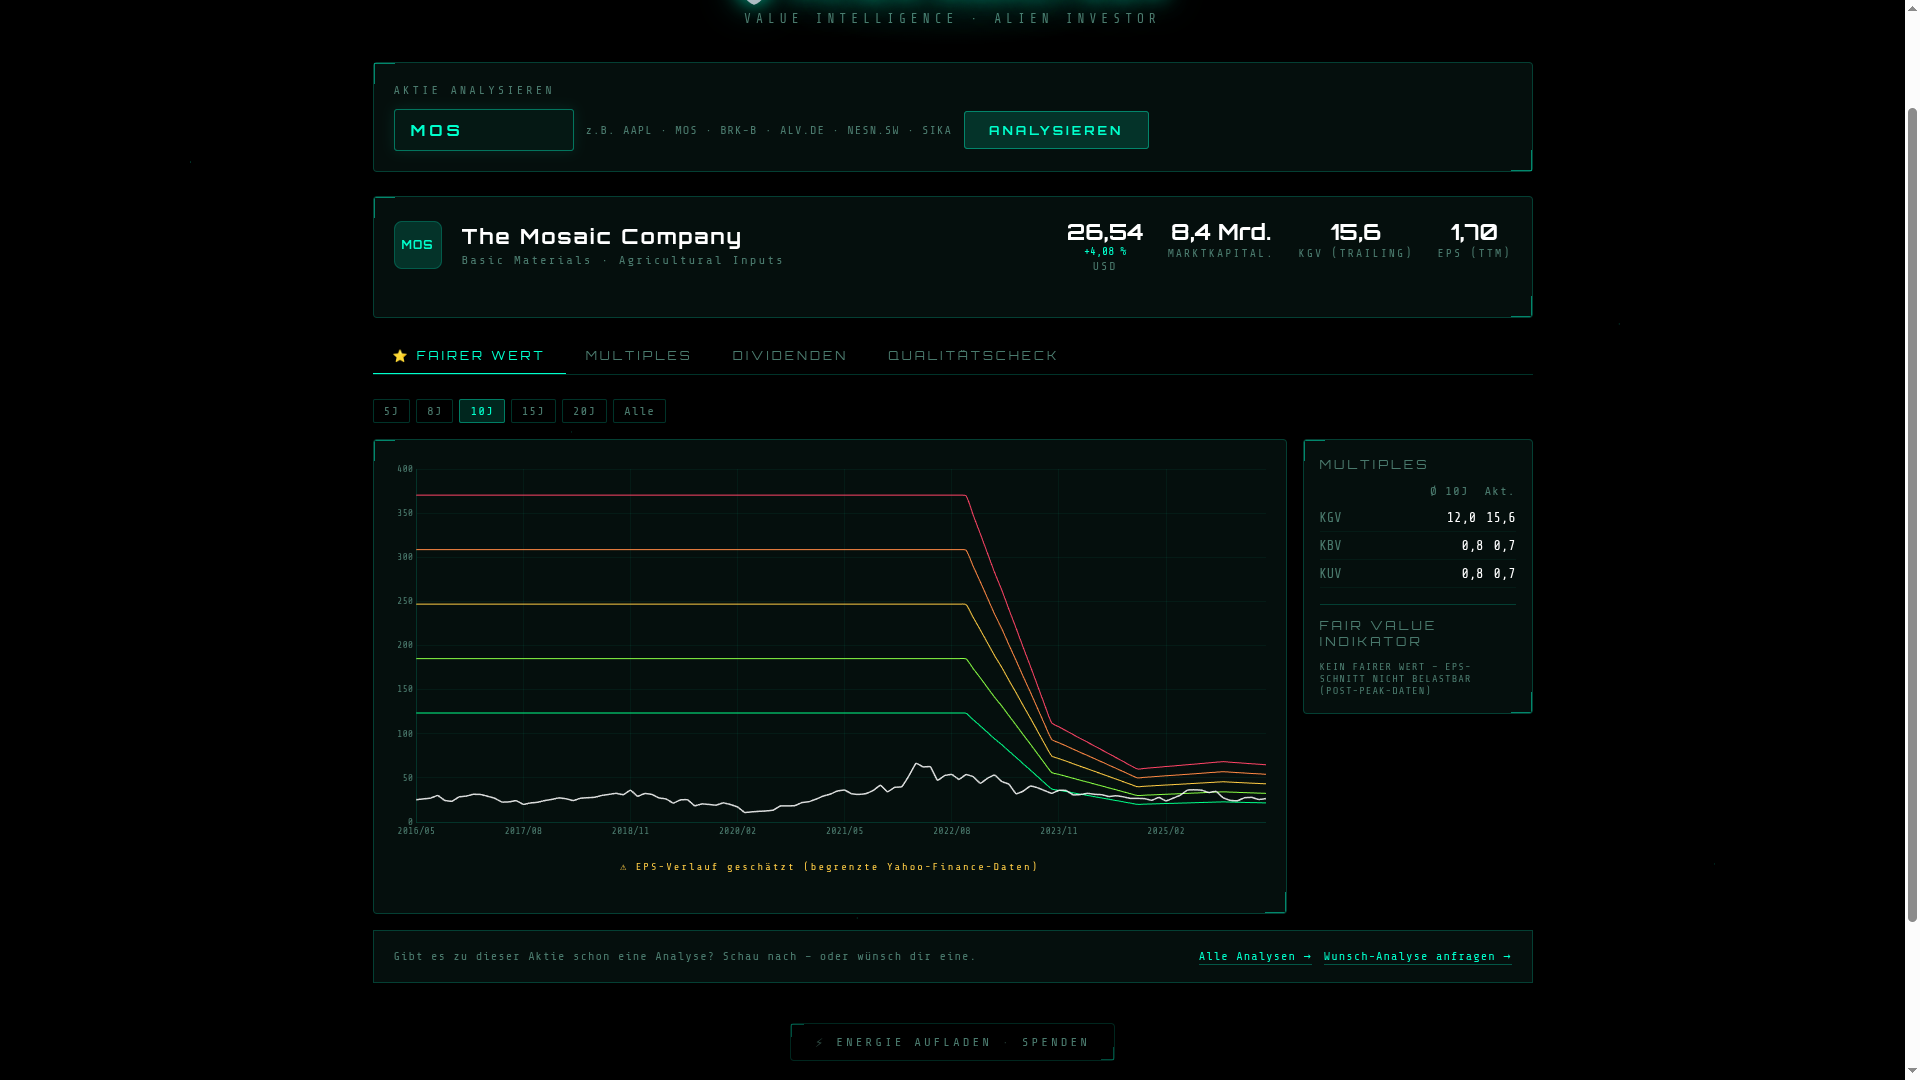
Alien Analyzer V2 — Fair Value tab: The 2022 EPS spike distorts the historical average so heavily that no reliable fair value can be calculated. The tool shows this transparently. ↗ Click to zoom
4) Profitability & Balance Sheet
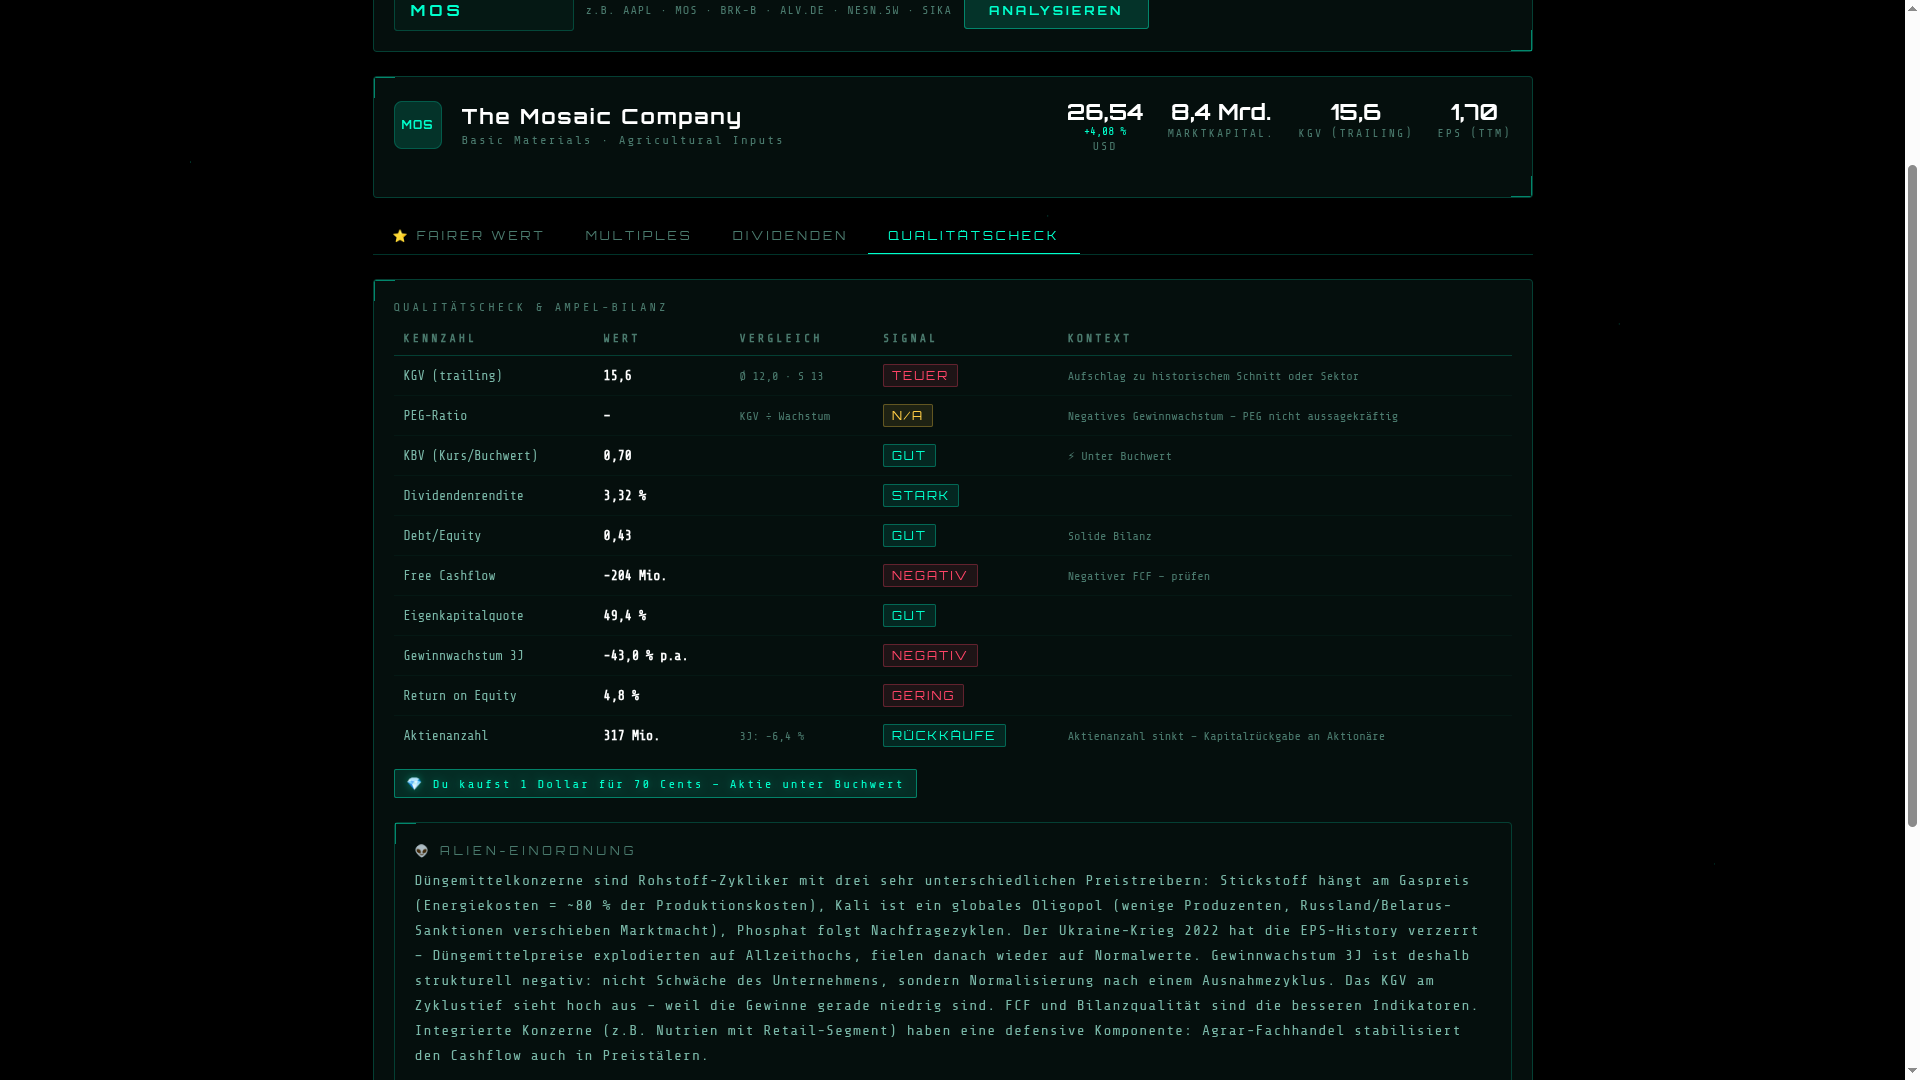
Alien Analyzer V2 — Quality Check: Traffic light overview of key metrics with contextual assessment. ↗ Click to zoom
The scorecard looks mixed — and that's explainable. P/B (0.70), Debt/Equity and equity ratio all show solid balance sheet substance. The red signals — negative FCF, negative earnings growth, low ROE — are all saying the same thing in different words: the company is at the cycle trough right now. A 2022 ROE of 25%+ doesn't show up in this picture.
Flagging a P/E of 15.6 as "EXPENSIVE" while the stock trades below book value is the classic cyclical contradiction: P/E high because earnings are depressed, P/B low because assets are real and stable.
On the dividend: $0.88/year ($0.22/quarter), yield 3.32%, payout ratio ~52%. Management is holding the dividend even though current FCF doesn't fully cover it. That's a bet on near-term normalization — not an unlimited promise.
5) Strategic Themes
Premium products: MicroEssentials®, the ammoniated premium fertilizer segment, makes Mosaic less dependent on raw commodity prices. If you sell a better product, you don't have to just wait for market prices to recover.
Portfolio discipline: Mosaic sold Mosaic Potash Carlsbad (less strategic) and cuts production in Brazil when sulfur prices run too high. Management doesn't act stubbornly — it adjusts capacity to the price environment.
Rare earths — the underrated wildcard: The Uberaba project in Brazil, developed jointly with Rainbow Rare Earths, extracts economically usable rare earth deposits from phosphate tailings. This value is not priced into the current share price. It's optionality — not a promise, but a real upside factor.
Outlook (analyst estimates): EPS 2026E: $1.88 (+11%) | EPS 2027E: $2.43 (+29%) | Revenue 2026E: $12.84B (+6.5%). No moon mission, but a controlled recovery.
6) Valuation in Context
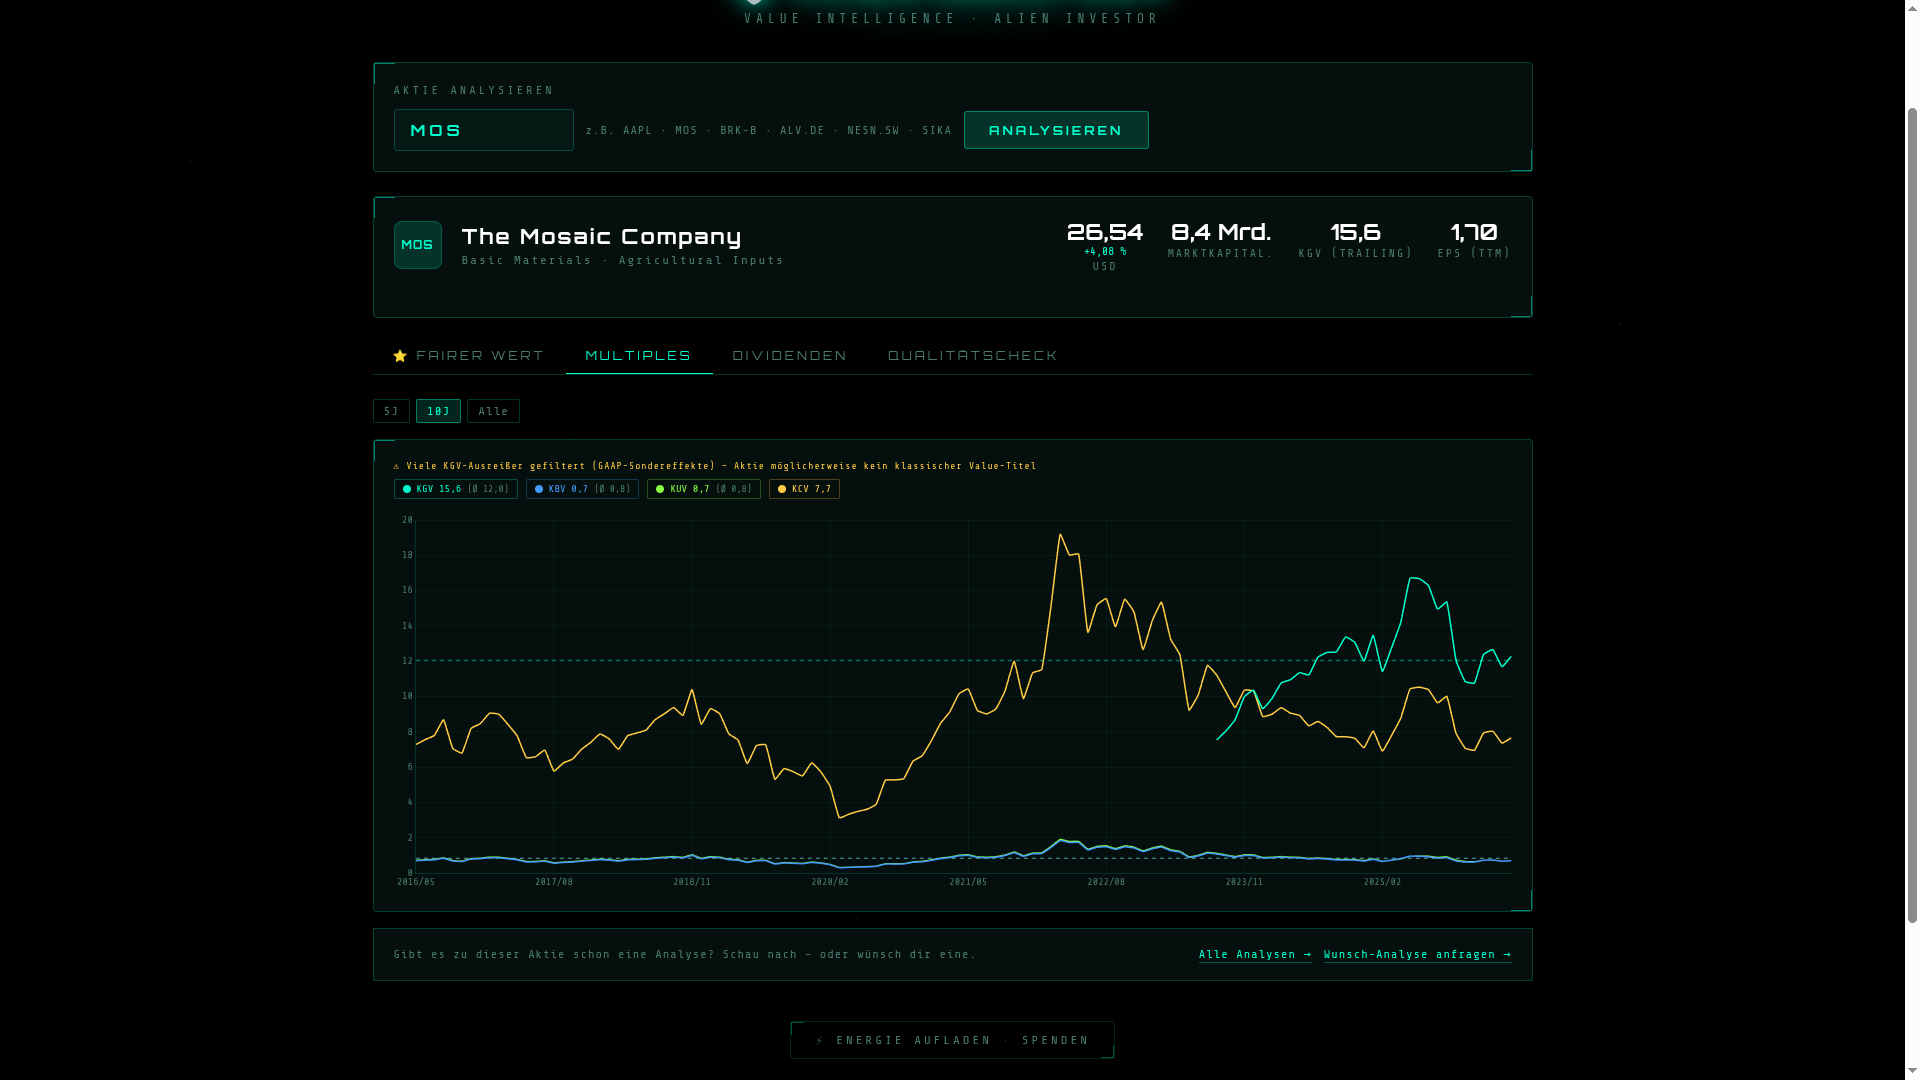
Alien Analyzer V2 — Multiples tab: P/E (15.6), P/B (0.7), P/S (0.7), P/CF (7.7) vs. 10-year comparison. The Analyzer warns: many P/E outliers filtered (GAAP special items). ↗ Click to zoom
The P/E sits above its historical average — even though the stock price is low. That's the cyclical paradox: depressed earnings make the P/E look expensive. P/B (0.70) and P/S (0.70) say the opposite: you're buying $1 of substance for 70 cents.
A better anchor than EPS multiples: normalized EPS at ~$2.00–$2.50 (analyst consensus 2027E: $2.43) × historical P/E of 12 yields a fair value of $24–$30. Current price $26.54 — right in the middle of that range. Not cheap, not expensive. Fair, at the bottom of the cycle.
Tool Tip
The metrics in this analysis come from Alien Analyzer V2 — the in-house screening tool for stocks. Fair value, multiples, dividends and quality check at a glance. Free, no login, no subscription.
alien-investor.org/alien-analyzer — Enter a ticker and analyze.
7) Competitive Landscape & Moat
| Company | Focus | Market Cap | Notable |
|---|---|---|---|
| Mosaic (MOS) | Phosphate + Potash | $8.4B | Largest integrated phosphate producer |
| Nutrien (NTR) | Phosphate + Potash + Retail | ~$34B | Retail segment stabilizes cash flow |
| ICL Group (ICL) | Potash + Specialty Fertilizers | ~$6.7B | Israel, specialty fertilizer focus |
| OCP Group | Phosphate (state-owned) | not listed | Morocco, aggressive capacity expansion |
| Yara International | Nitrogen | ~$8B | European, gas price dependent |
Mosaic vs. Nutrien: Nutrien has a retail agri-trade segment that stabilizes cash flow even during price troughs. Mosaic lacks that. In return, Mosaic is the purer bet on phosphate prices — with a cheaper valuation. Want a buffer: Nutrien. Want the more direct cyclical play: Mosaic.
OCP risk: The Moroccan state-owned phosphate giant is aggressively expanding capacity and pushing down global phosphate prices. That is structurally the biggest competitive risk for Mosaic's phosphate segment. [ESTIMATE — not verified against sources]
Geopolitical protection: Russia and Belarus are restricted as potash exporters due to sanctions. That reduces global supply and strengthens the pricing power of western producers like Mosaic in Saskatchewan.
8) Customer Perspective
Mosaic's customers are not end consumers. They are agri-traders, cooperatives and direct large-scale farmers — primarily in North America and Brazil. In Brazil, direct farmer contact via the Mosaic Fertilizantes distribution network.
Public B2B customer reviews don't exist for this segment. Customer retention comes from supply security and premium products (MicroEssentials) — not brand loyalty. [NOT AVAILABLE]
9) Employee Perspective
Mosaic employs around 15,000 people globally in mining, processing and logistics. The company publishes an annual Sustainability Report. Mining is capital-intensive and physically demanding — no tech company vibe, but globally one of the more stable employers in the commodity sector. [NOT AVAILABLE — no public employer reviews evaluable]
10) Opportunities & Risks
11) Alien Verdict
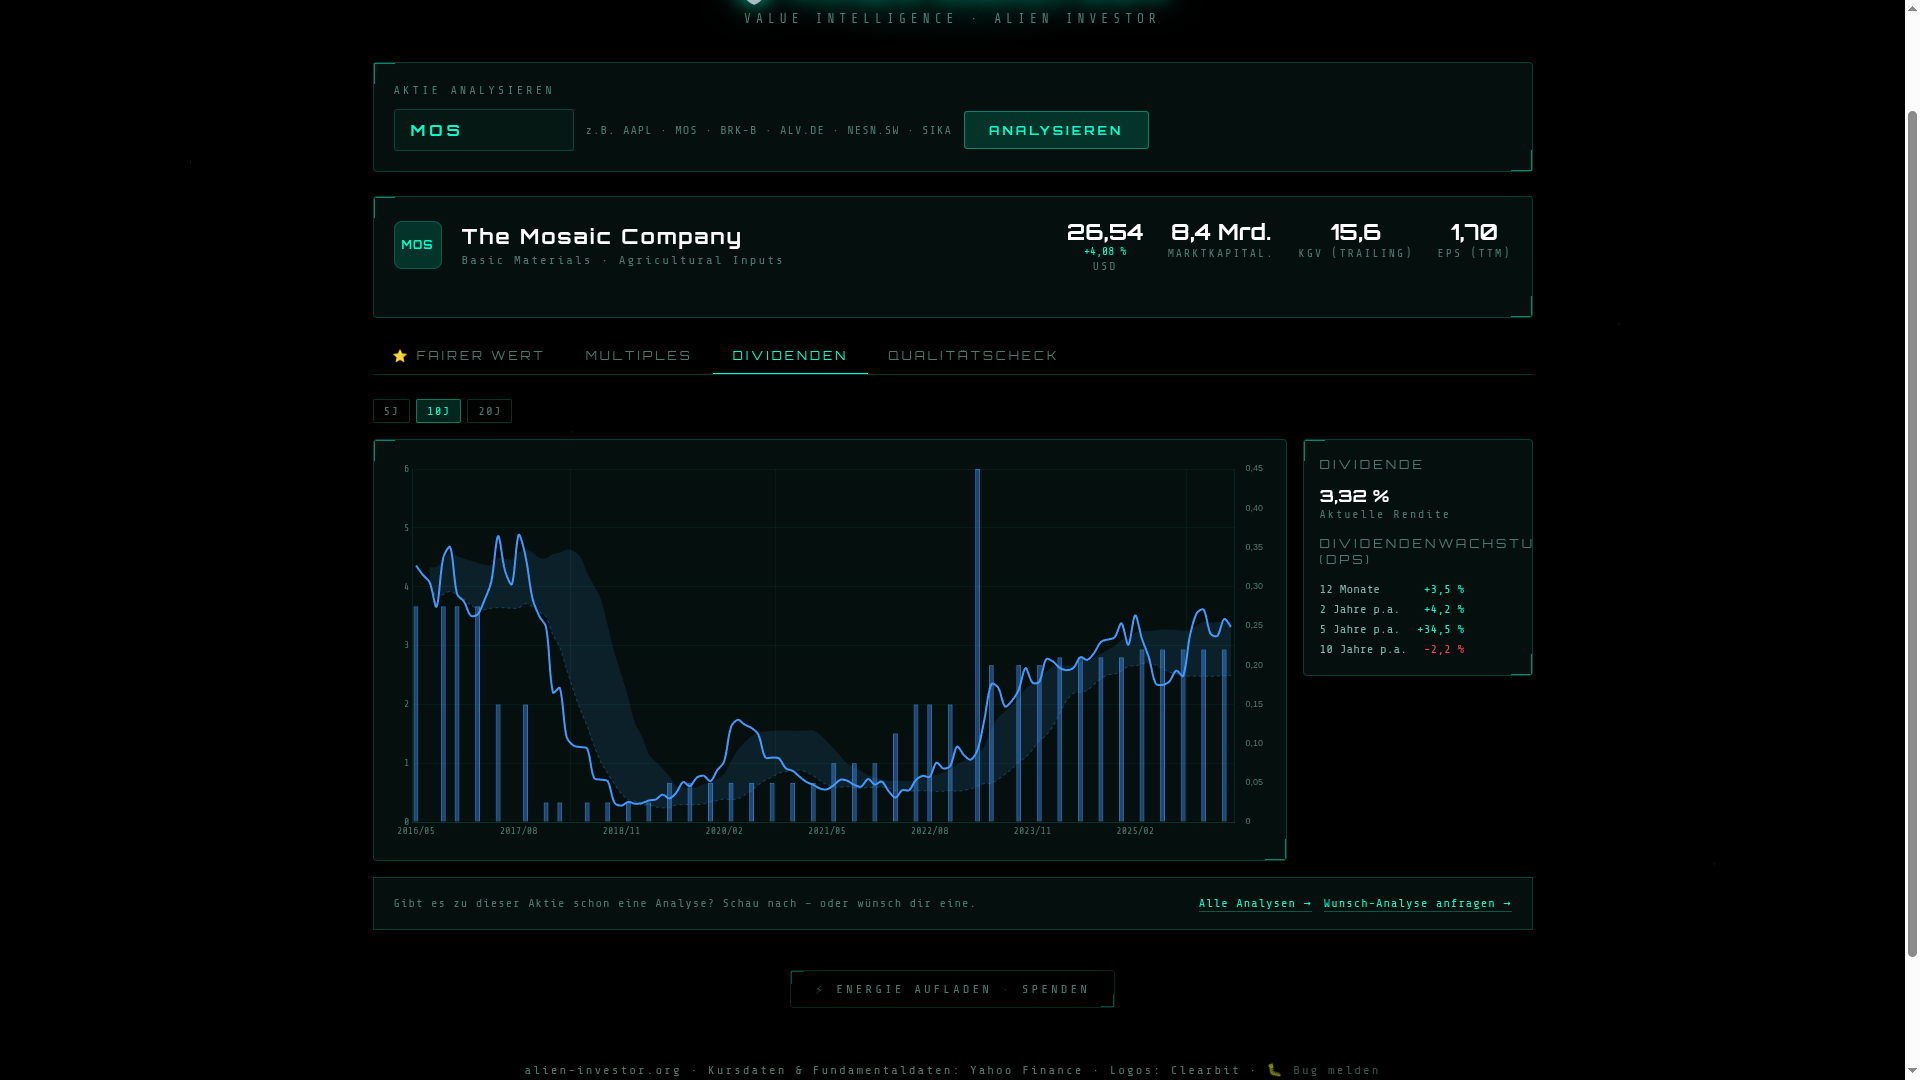
Alien Analyzer V2 — Dividends tab: 3.32% yield, +34.5% dividend growth p.a. over 5 years — after the deep cut in 2020/2021. ↗ Click to zoom
Mosaic is a commodity cyclical with a global market leadership position that can't simply be replicated. The moat is in the geology — not in patents, brands or network effects. If you don't have the mines, you can't play.
The numbers look ugly at the cycle trough. That's the point. P/B 0.70 means: you're buying $1 of real substance (mines, plants, inventory) for 70 cents. That's also been the better entry point for other cyclicals at their lows — not when earnings were gushing at the peak.
The real question is when fertilizer prices normalize — not whether. More people need more food. More food needs more fertilizer. That's not a trend, that's arithmetic. One counterargument remains OCP: Morocco's state-owned phosphate giant is aggressively expanding capacity and could structurally pressure prices.
Buying Mosaic is not a bet on a growth company. You're buying real assets below book value, a 3.3% dividend as payment for patience, and a free option on the next price cycle.
"You're buying $1 for 70 cents — and getting paid to wait."